

Question: Formulas needed You are responsible for developing a model that analyzes the potential investment, providing valuations of alternate strategies and a sensitivity analysis of the
Formulas needed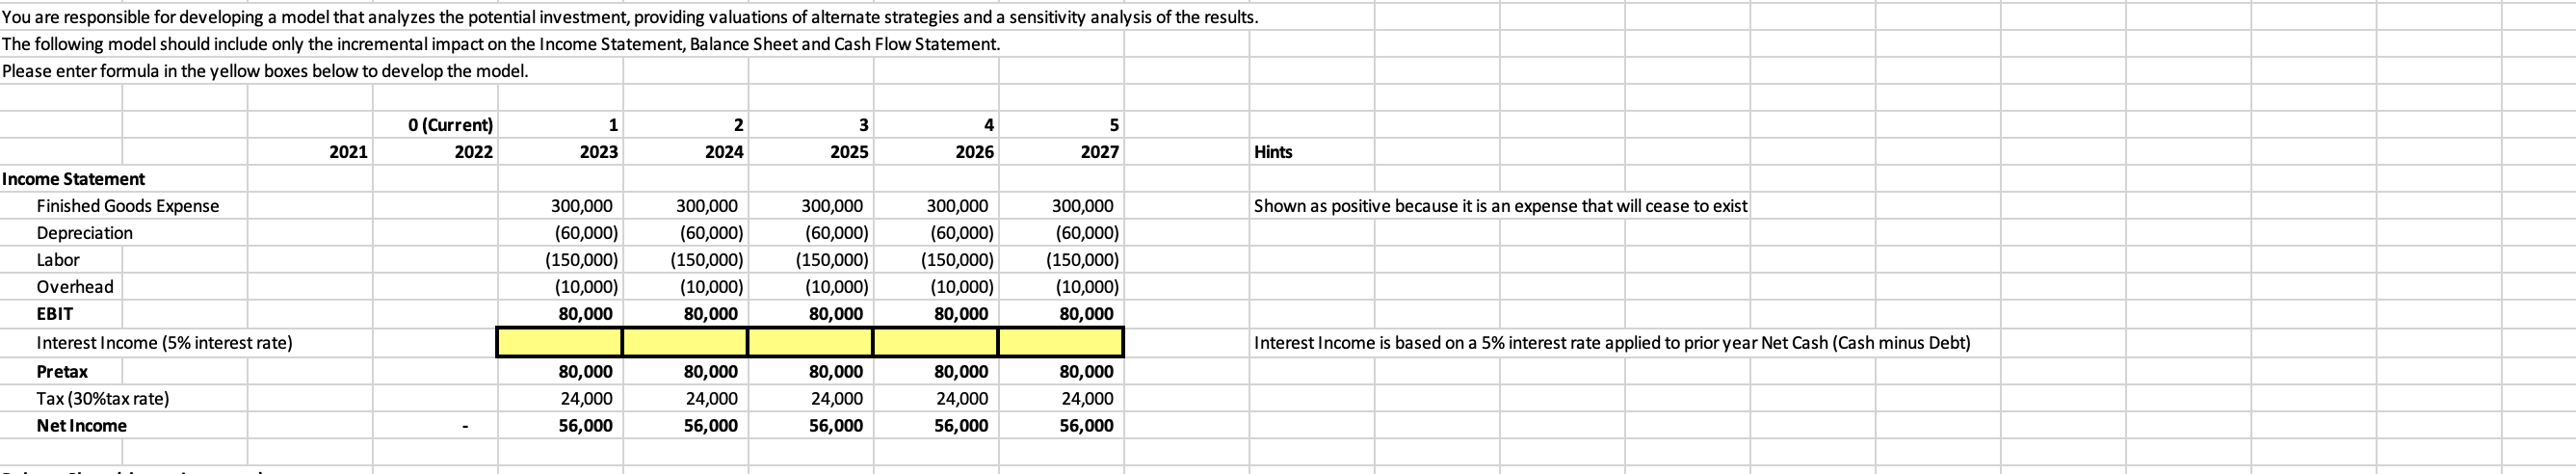
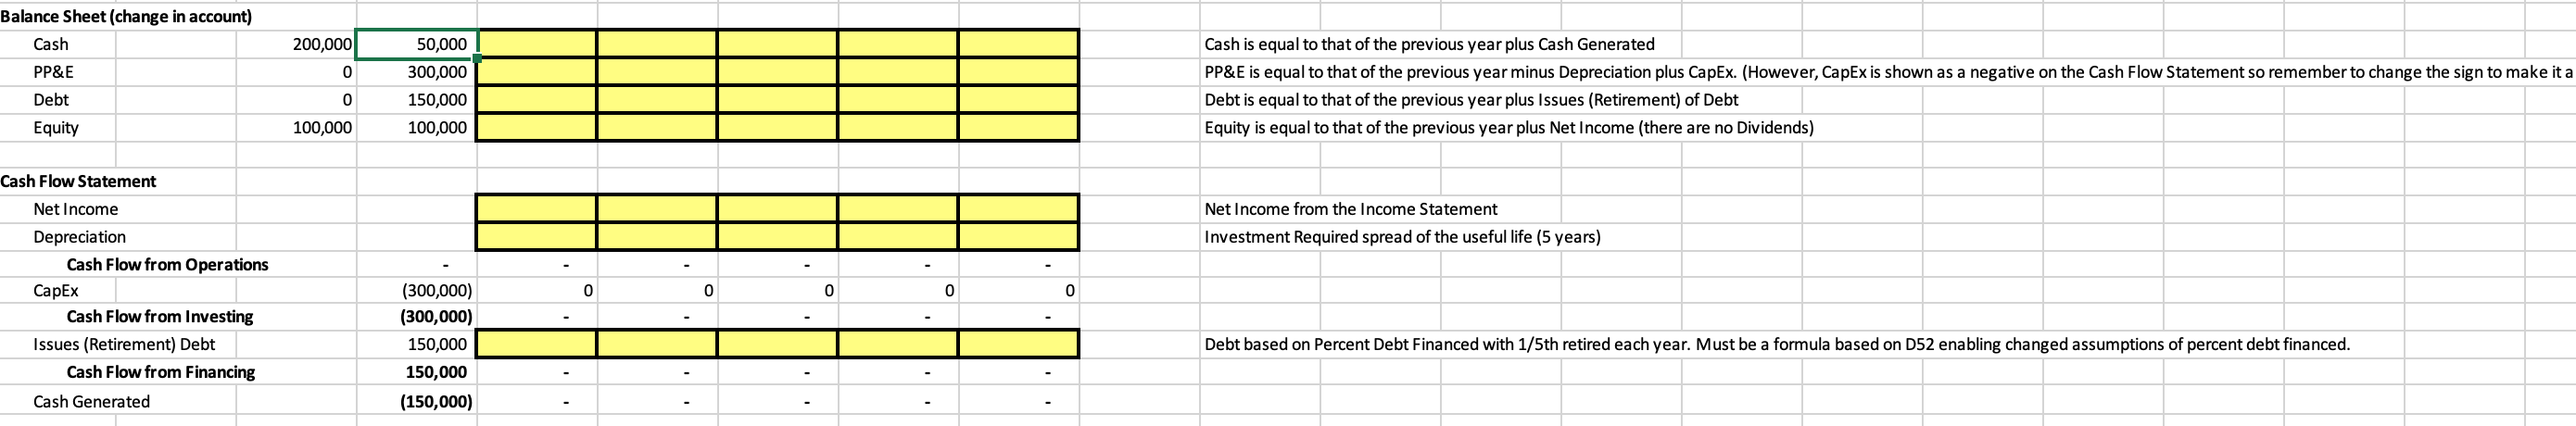
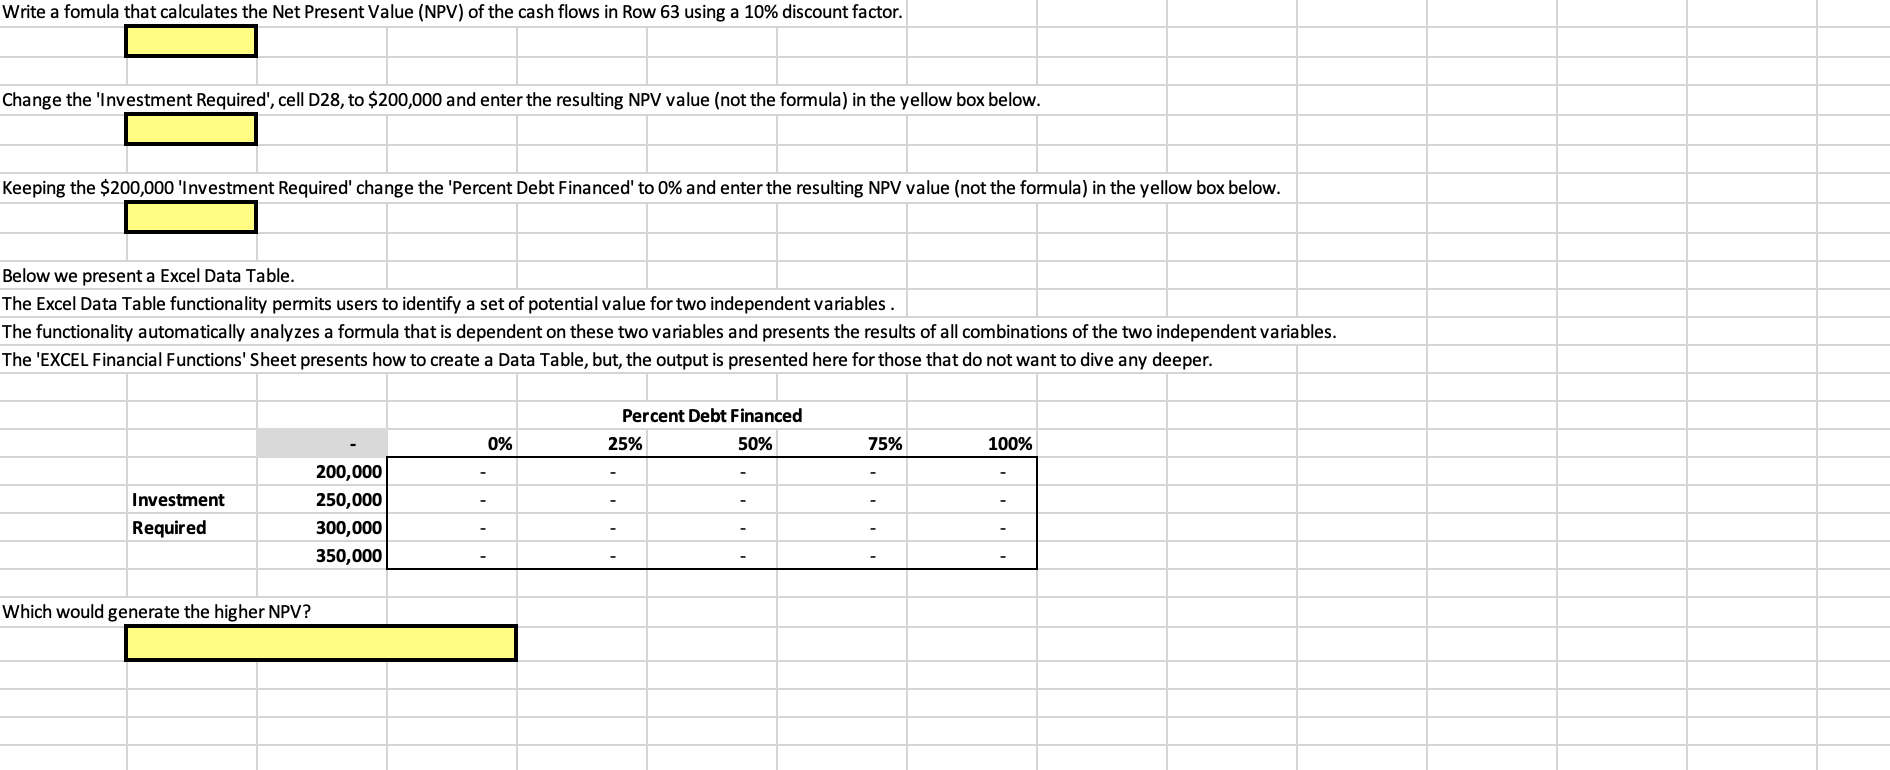
You are responsible for developing a model that analyzes the potential investment, providing valuations of alternate strategies and a sensitivity analysis of the results. The following model should include only the incremental impact on the Income Statement, Balance Sheet and Cash Flow Statement. Please enter formula in the yellow boxes below to develop the model. 2 0 (Current) 2022 1 2023 3 2025 4 2026 5 2027 2021 2024 Hints Shown as positive because it is an expense that will cease to exist Income Statement Finished Goods Expense Depreciation Labor Overhead EBIT Interest Income (5% interest rate) Pretax Tax (30%tax rate) Net Income 300,000 (60,000) (150,000) (10,000) 80,000 300,000 (60,000) (150,000) (10,000) 80,000 300,000 (60,000) (150,000) (10,000) 80,000 300,000 (60,000) (150,000) (10,000) 80,000 300,000 (60,000) (150,000) (10,000) 80,000 Interest Income is based on a 5% interest rate applied to prior year Net Cash (Cash minus Debt) 80,000 24,000 56,000 80,000 24,000 56,000 80,000 24,000 56,000 80,000 24,000 56,000 80,000 24,000 56,000 Balance Sheet (change in account) Cash 200,000 PP&E 0 50,000 300,000 150,000 100,000 Cash is equal to that of the previous year plus Cash Generated PP&E is equal to that of the previous year minus Depreciation plus CapEx. (However, CapEx is shown as a negative on the Cash Flow Statement so remember to change the sign to make it a Debt is equal to that of the previous year plus Issues (Retirement) of Debt Equity is equal to that of the previous year plus Net Income (there are no Dividends) Debt 0 Equity 100,000 Net Income from the Income Statement Investment Required spread of the useful life (5 years) Cash Flow Statement Net Income Depreciation Cash Flow from Operations CapEx Cash Flow from Investing Issues (Retirement) Debt Cash Flow from Financing Cash Generated 0 0 0 0 0 (300,000) (300,000) 150,000 150,000 (150,000) Debt based on Percent Debt Financed with 1/5th retired each year. Must be a formula based on D52 enabling changed assumptions of percent debt financed. Write a fomula that calculates the Net Present Value (NPV) of the cash flows in Row 63 using a 10% discount factor. Change the 'Investment Required', cell D28, to $200,000 and enter the resulting NPV value (not the formula) in the yellow box below. Keeping the $200,000 'Investment Required' change the 'Percent Debt Financed' to 0% and enter the resulting NPV value (not the formula) in the yellow box below. Below we present a Excel Data Table. The Excel Data Table functionality permits users to identify a set of potential value for two independent variables. The functionality automatically analyzes a formula that is dependent on these two variables and presents the results of all combinations of the two independent variables. The 'EXCEL Financial Functions' Sheet presents how to create a Data Table, but the output is presented here for those that do not want to dive any deeper. Percent Debt Financed 25% 50% 0% 75% 100% Investment Required 200,000 250,000 300,000 350,000 Which would generate the higher NPV? You are responsible for developing a model that analyzes the potential investment, providing valuations of alternate strategies and a sensitivity analysis of the results. The following model should include only the incremental impact on the Income Statement, Balance Sheet and Cash Flow Statement. Please enter formula in the yellow boxes below to develop the model. 2 0 (Current) 2022 1 2023 3 2025 4 2026 5 2027 2021 2024 Hints Shown as positive because it is an expense that will cease to exist Income Statement Finished Goods Expense Depreciation Labor Overhead EBIT Interest Income (5% interest rate) Pretax Tax (30%tax rate) Net Income 300,000 (60,000) (150,000) (10,000) 80,000 300,000 (60,000) (150,000) (10,000) 80,000 300,000 (60,000) (150,000) (10,000) 80,000 300,000 (60,000) (150,000) (10,000) 80,000 300,000 (60,000) (150,000) (10,000) 80,000 Interest Income is based on a 5% interest rate applied to prior year Net Cash (Cash minus Debt) 80,000 24,000 56,000 80,000 24,000 56,000 80,000 24,000 56,000 80,000 24,000 56,000 80,000 24,000 56,000 Balance Sheet (change in account) Cash 200,000 PP&E 0 50,000 300,000 150,000 100,000 Cash is equal to that of the previous year plus Cash Generated PP&E is equal to that of the previous year minus Depreciation plus CapEx. (However, CapEx is shown as a negative on the Cash Flow Statement so remember to change the sign to make it a Debt is equal to that of the previous year plus Issues (Retirement) of Debt Equity is equal to that of the previous year plus Net Income (there are no Dividends) Debt 0 Equity 100,000 Net Income from the Income Statement Investment Required spread of the useful life (5 years) Cash Flow Statement Net Income Depreciation Cash Flow from Operations CapEx Cash Flow from Investing Issues (Retirement) Debt Cash Flow from Financing Cash Generated 0 0 0 0 0 (300,000) (300,000) 150,000 150,000 (150,000) Debt based on Percent Debt Financed with 1/5th retired each year. Must be a formula based on D52 enabling changed assumptions of percent debt financed. Write a fomula that calculates the Net Present Value (NPV) of the cash flows in Row 63 using a 10% discount factor. Change the 'Investment Required', cell D28, to $200,000 and enter the resulting NPV value (not the formula) in the yellow box below. Keeping the $200,000 'Investment Required' change the 'Percent Debt Financed' to 0% and enter the resulting NPV value (not the formula) in the yellow box below. Below we present a Excel Data Table. The Excel Data Table functionality permits users to identify a set of potential value for two independent variables. The functionality automatically analyzes a formula that is dependent on these two variables and presents the results of all combinations of the two independent variables. The 'EXCEL Financial Functions' Sheet presents how to create a Data Table, but the output is presented here for those that do not want to dive any deeper. Percent Debt Financed 25% 50% 0% 75% 100% Investment Required 200,000 250,000 300,000 350,000 Which would generate the higher NPV
Step by Step Solution
There are 3 Steps involved in it

Get step-by-step solutions from verified subject matter experts