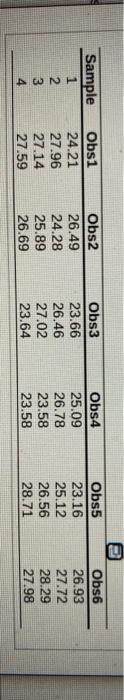
Question: Four samples (k = 4) are taken from a process with each sample consisting of six observations (n=6). The length in centimeters of each sampled

Four samples (k = 4) are taken from a process
Four samples (k = 4) are taken from a process with each sample consisting of six observations (n=6). The length in centimeters of each sampled item was measured with the following results. Develop an R Chart to determine if the dispersion is stable or not Click the icon to view the samples data, Click the icon to view the values of the D, and D, constants. The average of the sample ranges is (Enter your response rounded to wo decimal places.) The lower controllimit is (Enter your response rounded to two decimal places) The upper controllimit is (Enter your response rounded to no decimal places.) Plot the range values, center line and control limits on the process control R chart. Choose the correct graph below, OB . OD + O OC The process Click to select your answers Sample 1 2 3 4 Obs1 24.21 27.96 27.14 27.59 Obs2 26.49 24.28 25.89 26.69 Obs3 23.66 26.46 27.02 23.64 Obs4 25.09 26.78 23.58 23.58 Obs5 23.16 25.12 26.56 28.71 Obs6 26.93 27.72 28.29 27.98 D3 Choos 2 3 4 5 6 OOOOO DA 3.268 2.574 2.282 27114 2.304

Step by Step Solution

There are 3 Steps involved in it

1 Expert Approved Answer
Step: 1 Unlock blur-text-image
Question Has Been Solved by an Expert!

Get step-by-step solutions from verified subject matter experts

Step: 2 Unlock
Step: 3 Unlock

Students Have Also Explored These Related General Management Questions!