

Question: fQuestion Answer Does the annual sales box plot chart look symmetric? | do not think it is symmetric. In order for it to be symmetric,
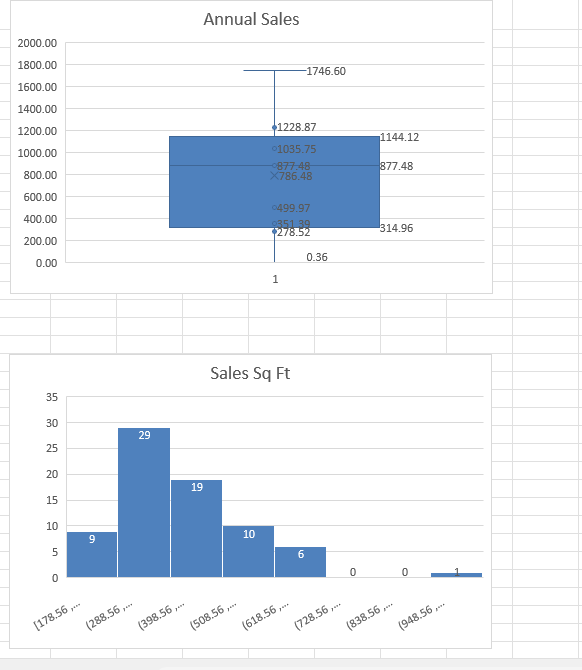
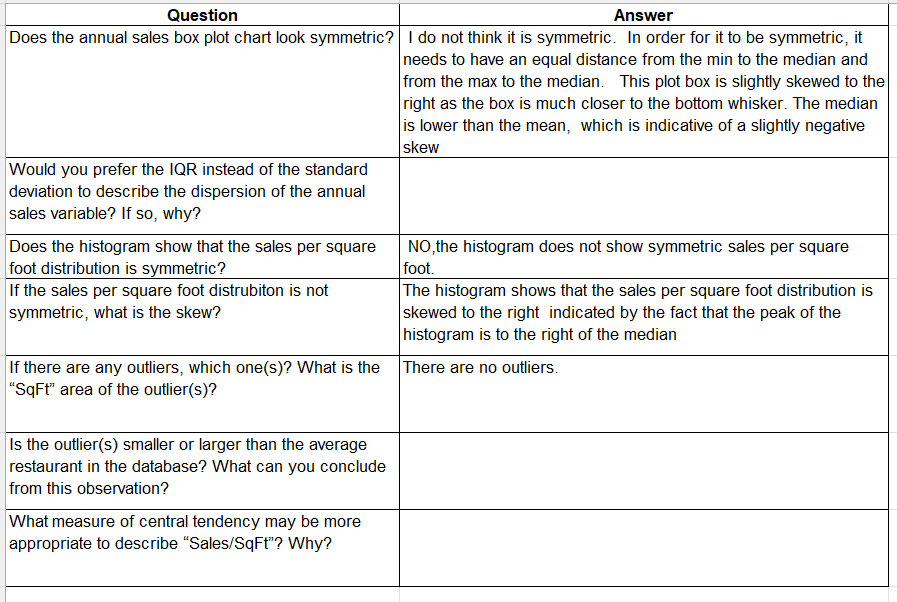
\fQuestion Answer Does the annual sales box plot chart look symmetric? | do not think it is symmetric. In order for it to be symmetric, it needs to have an equal distance from the min to the median and from the max to the median. This plot box is slightly skewed to the right as the box is much closer to the bottom whisker. The median is lower than the mean, which is indicative of a slightly negative skew Would you prefer the IQR instead of the standard deviation to describe the dispersion of the annual sales variable? If so, why? Does the histogram show that the sales per square foot distribution is symmetric? If the sales per square foot distrubiton is not symmetric, what is the skew? NO the histogram does not show symmetric sales per square foot. The histogram shows that the sales per square foot distribution is skewed to the right indicated by the fact that the peak of the histogram is to the right of the median If there are any outliers, which one(s)? What is the \"SqFt\" area of the outlier(s)? Is the outlier(s) smaller or larger than the average restaurant in the database? What can you conclude from this observation? There are no outliers. What measure of central tendency may be more appropriate to describe \"Sales/SqgFt? Why
Step by Step Solution
There are 3 Steps involved in it

Get step-by-step solutions from verified subject matter experts