

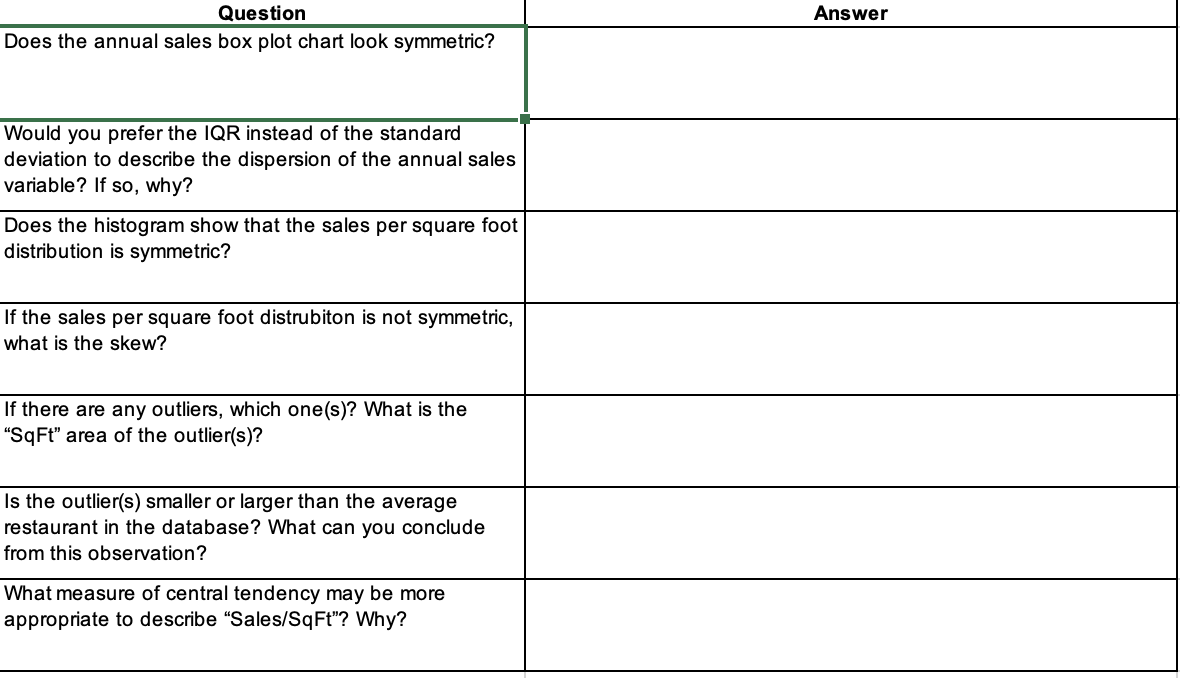
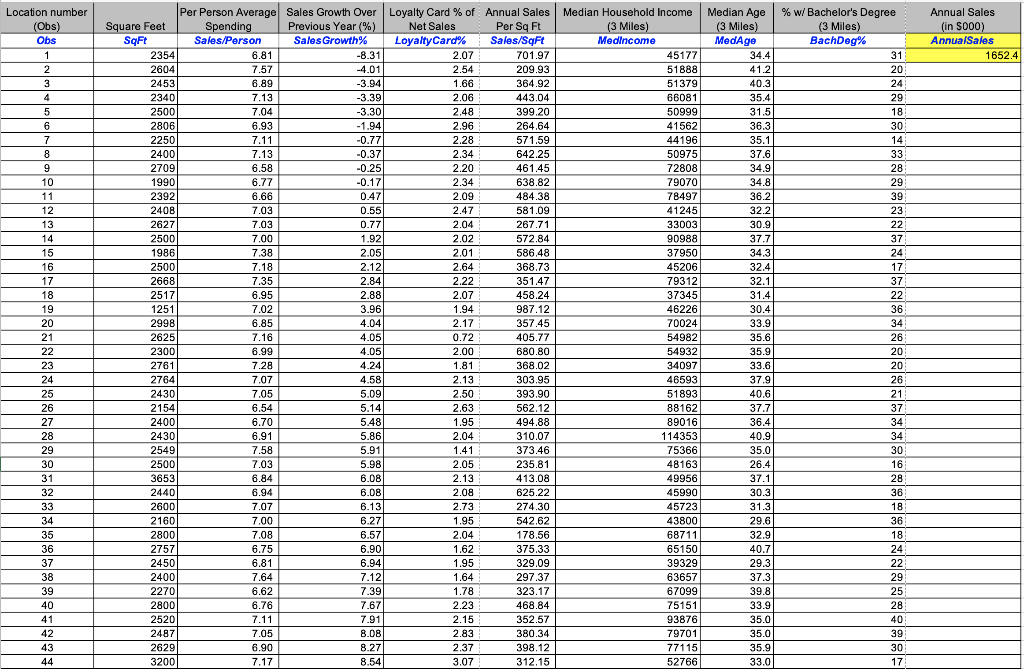
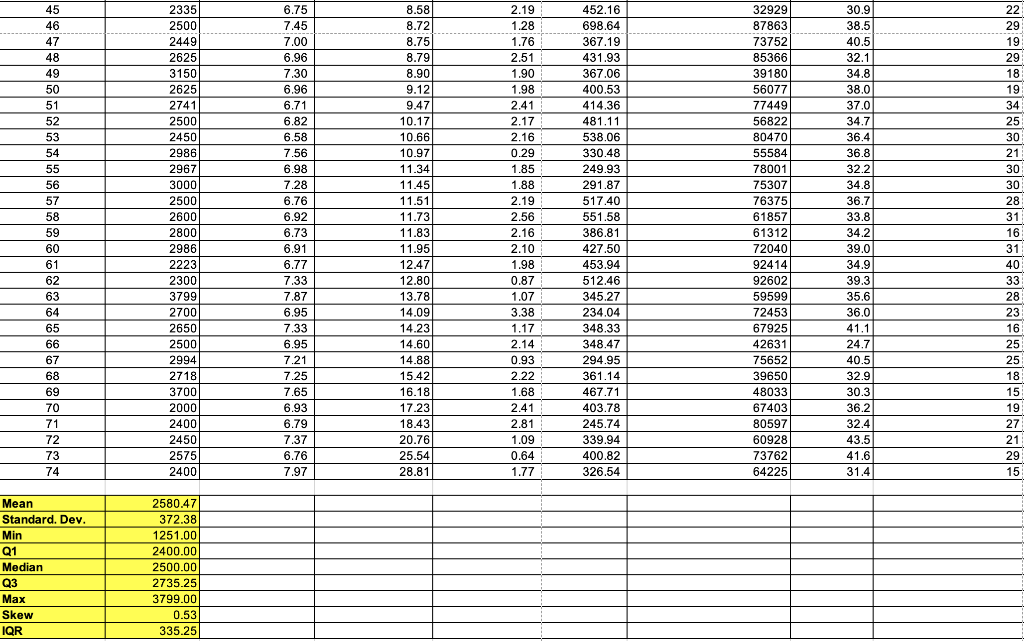
Question: Please help with questions based on this data . Thank you so much ! Does the annual sales box plot chart look symmetric? Answer Would
Please help with questions based on this data . Thank you so much !
Does the annual sales box plot chart look symmetric? Answer Would you prefer the IQR instead of the standard deviation to describe the dispersion of the annual sales variable? If so, why? Does the histogram show that the sales per square foot distribution is symmetric? If the sales per square foot distrubiton is not symmetric, what is the skew? If there are any outliers, which one(s)? What is the "SqFt" area of the outlier(s)? Is the outlier(s) smaller or larger than the average restaurant in the database? What can you conclude from this observation? What measure of central tendency may be more appropriate to describe "Sales/SqFt"? Why
Step by Step Solution
There are 3 Steps involved in it

Get step-by-step solutions from verified subject matter experts