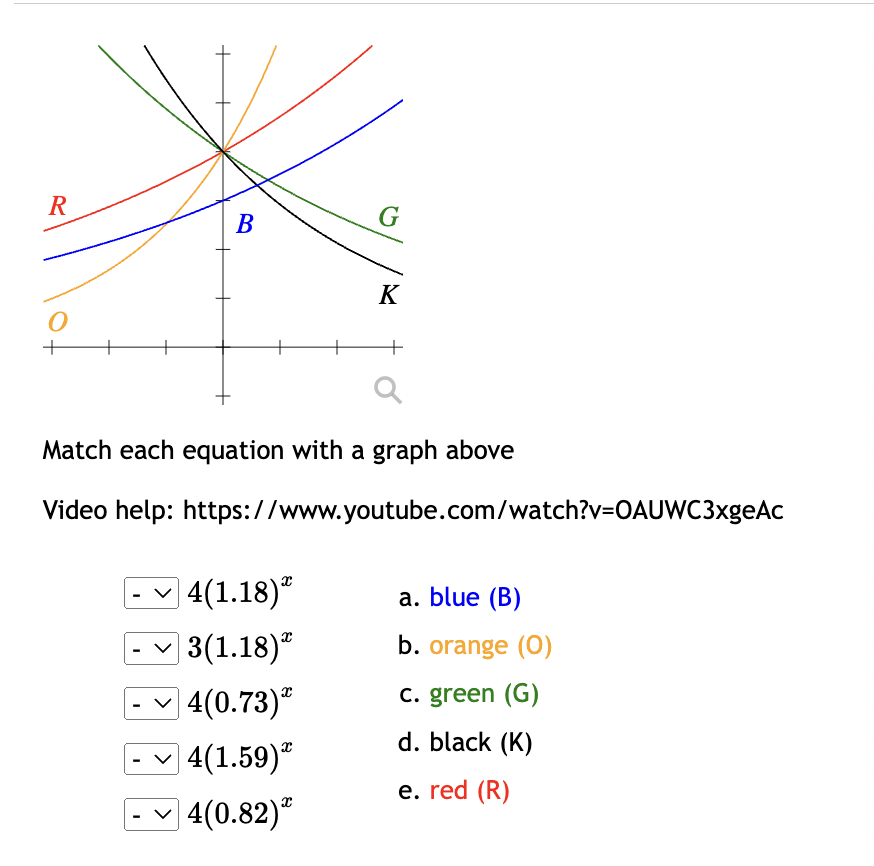
Question: fR B G K Match each equation with a graph above Video help: https:/ /www.youtube.com/watch?v=OAUWC3xgeAc - 4(1.18) a. blue (B) 3 (1.18) b. orange (0)
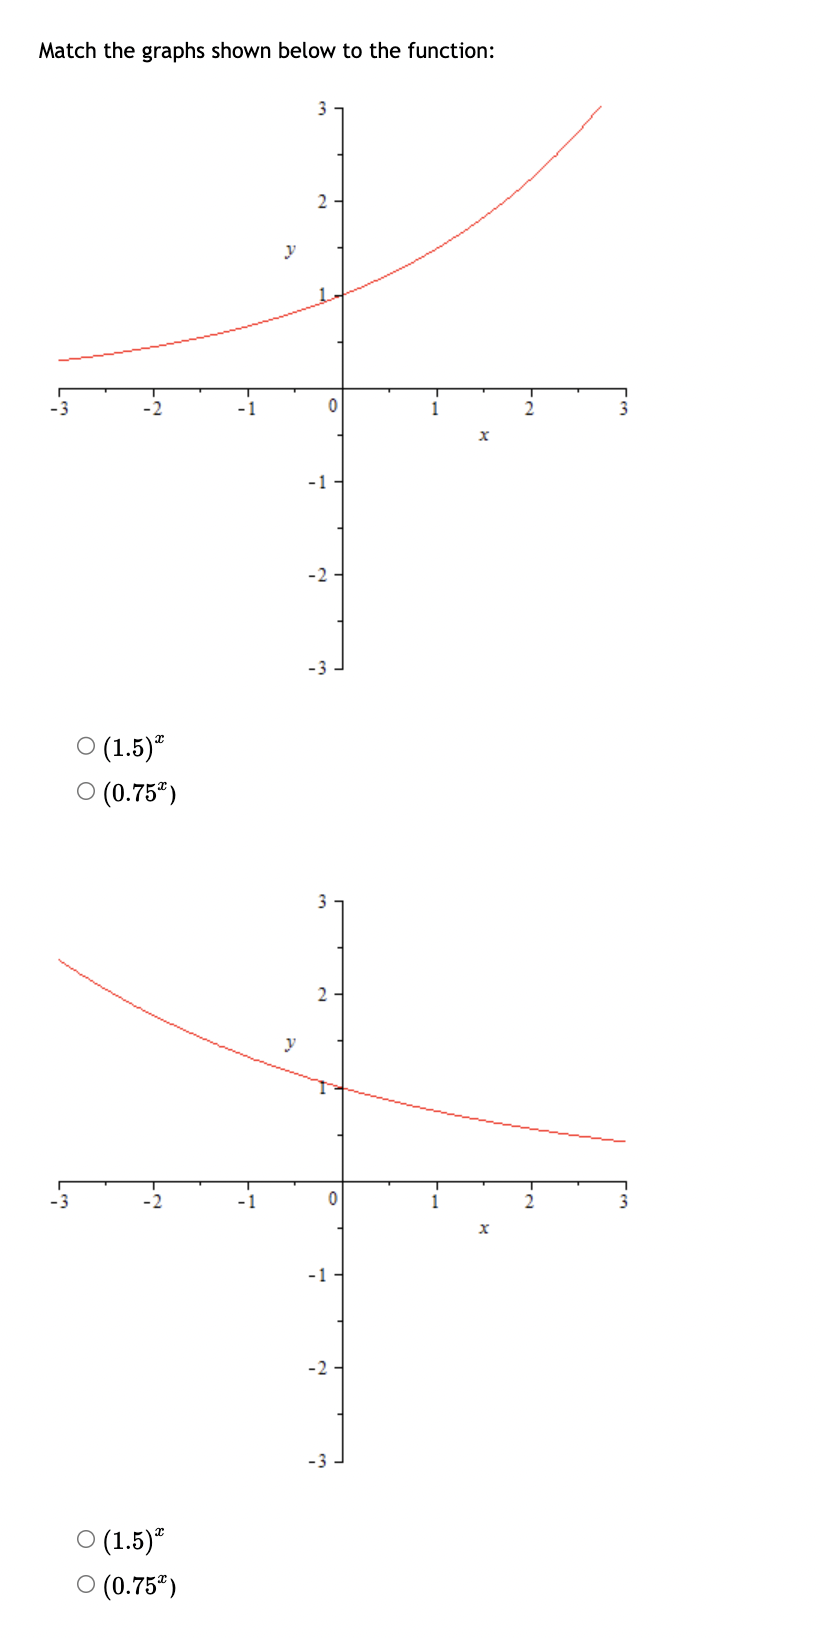
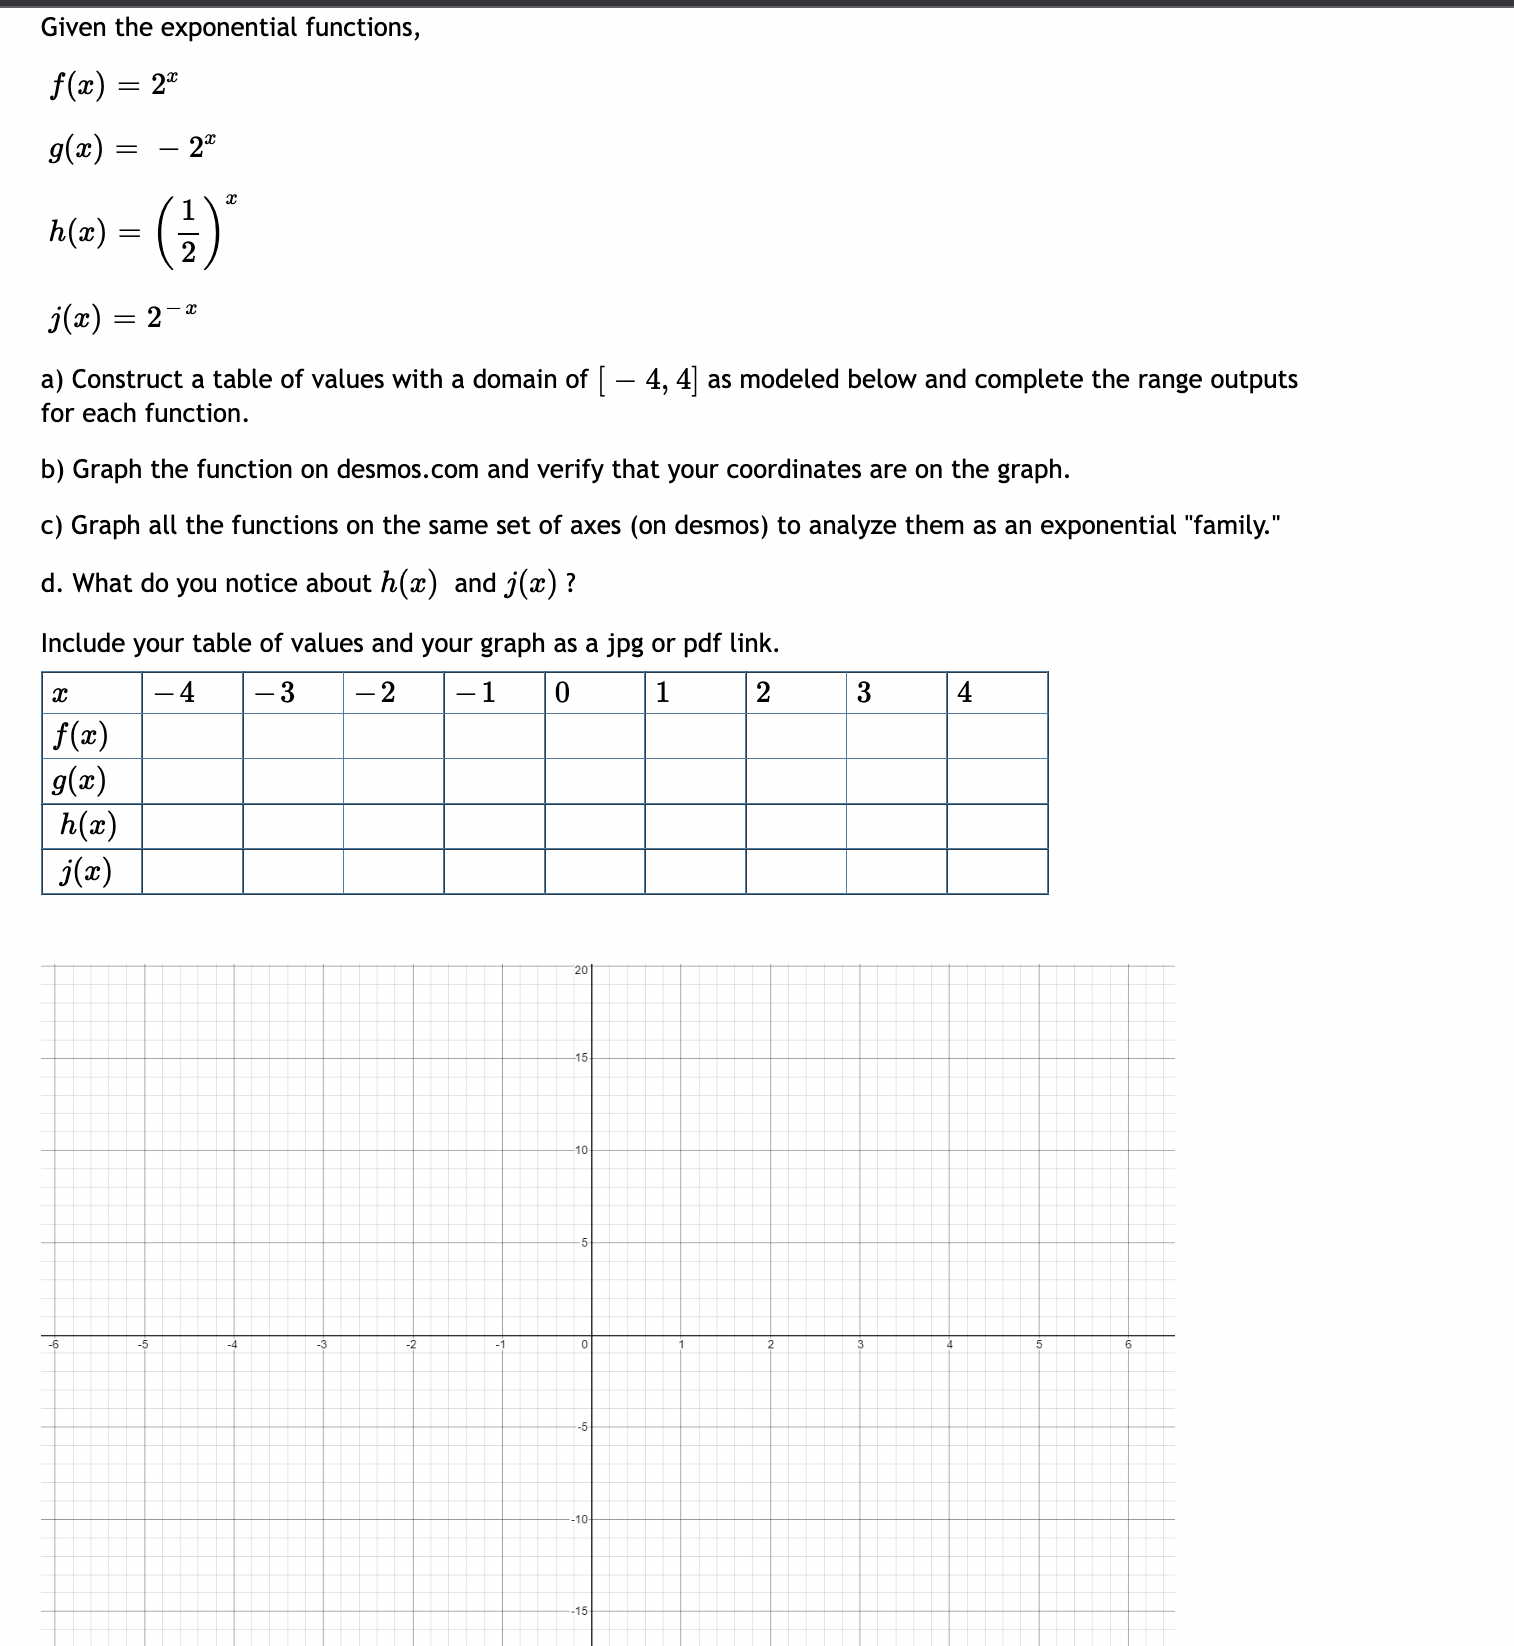
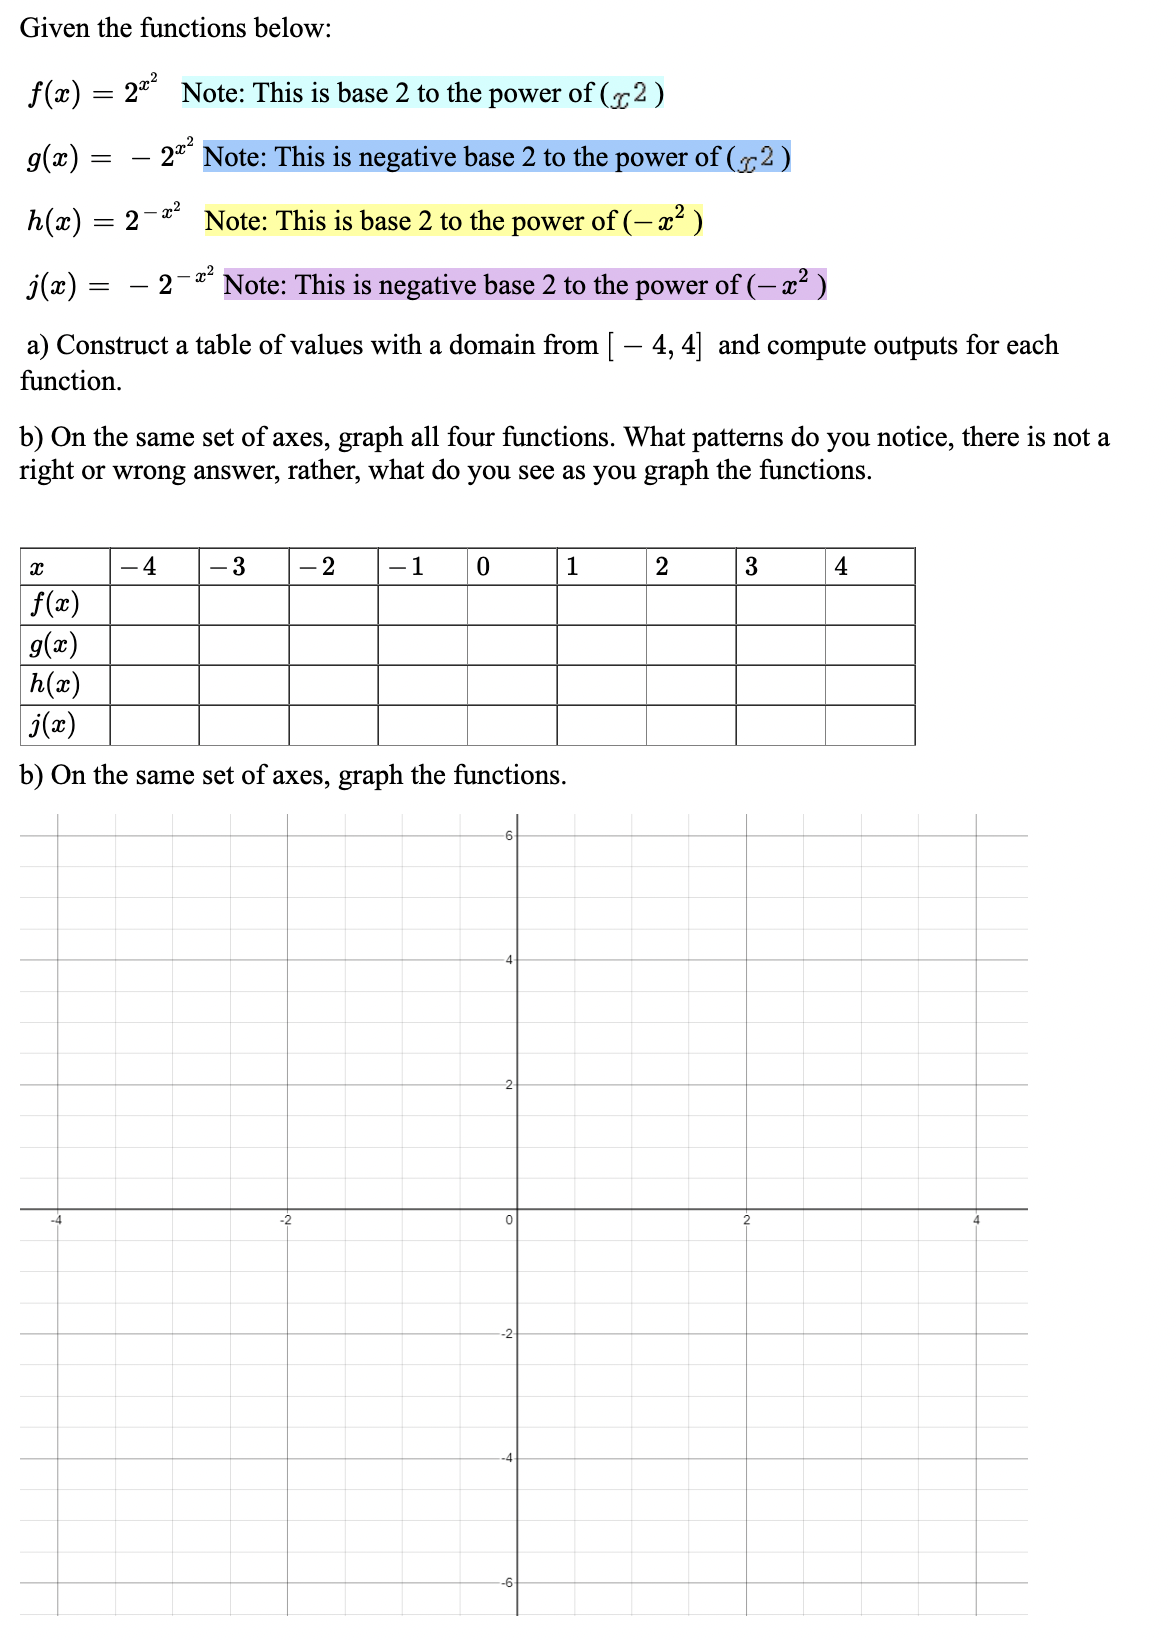
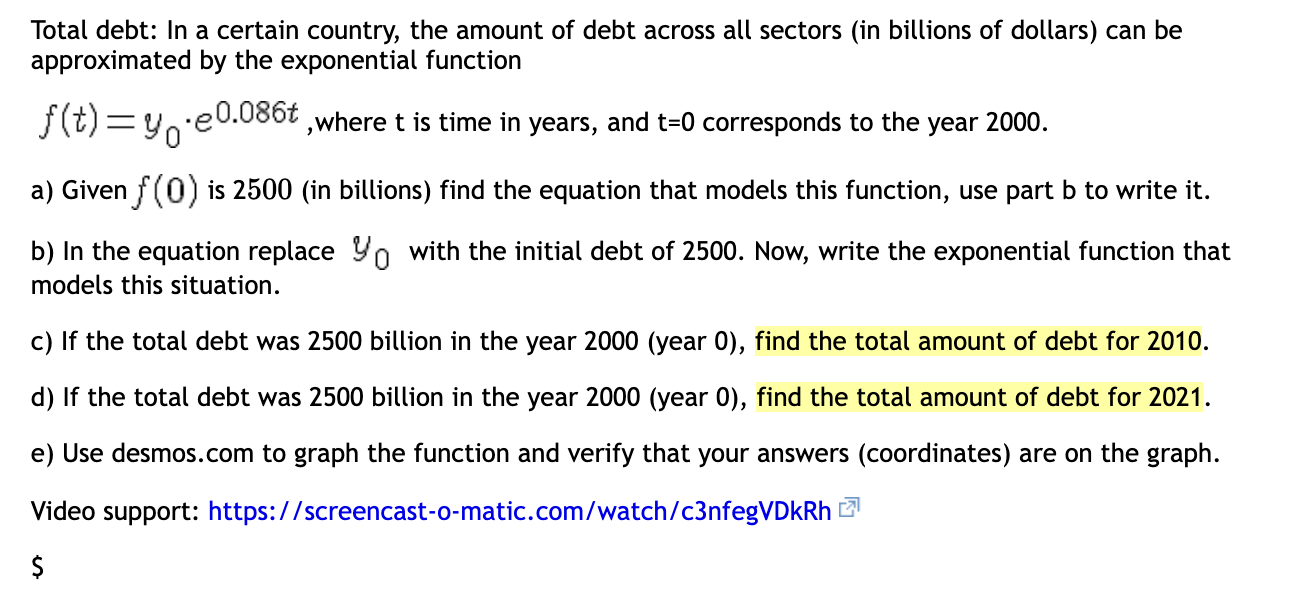
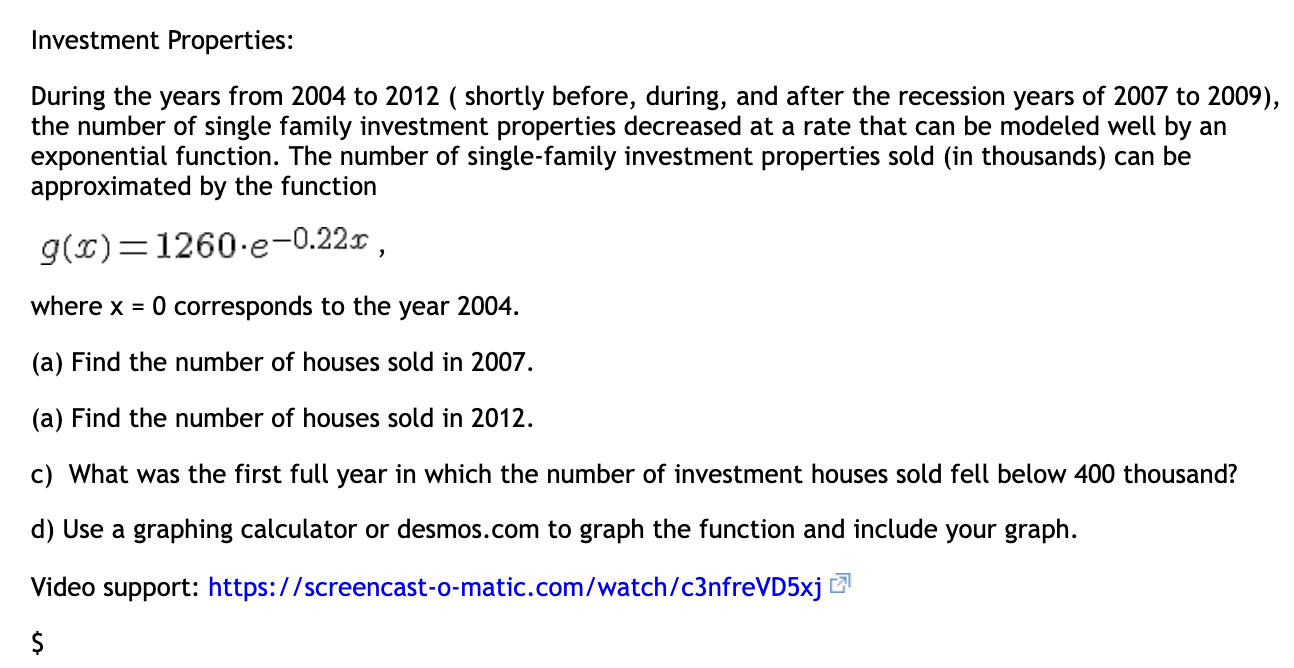
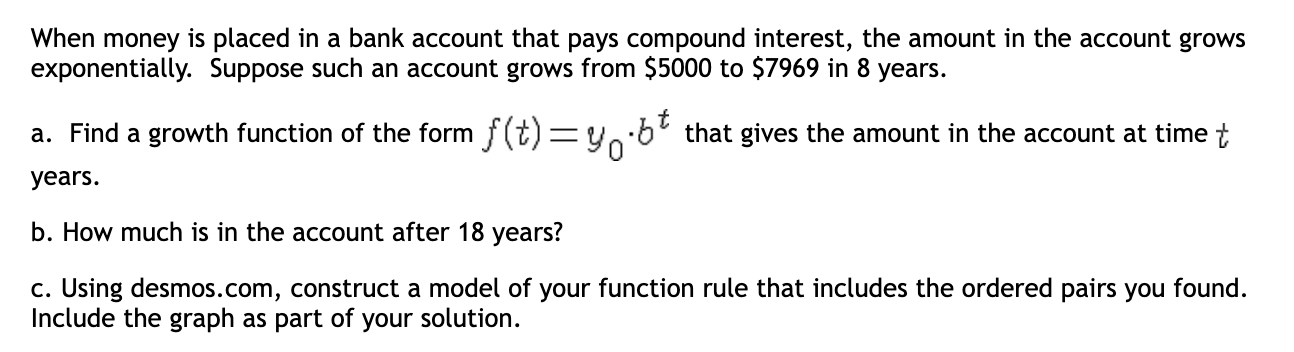
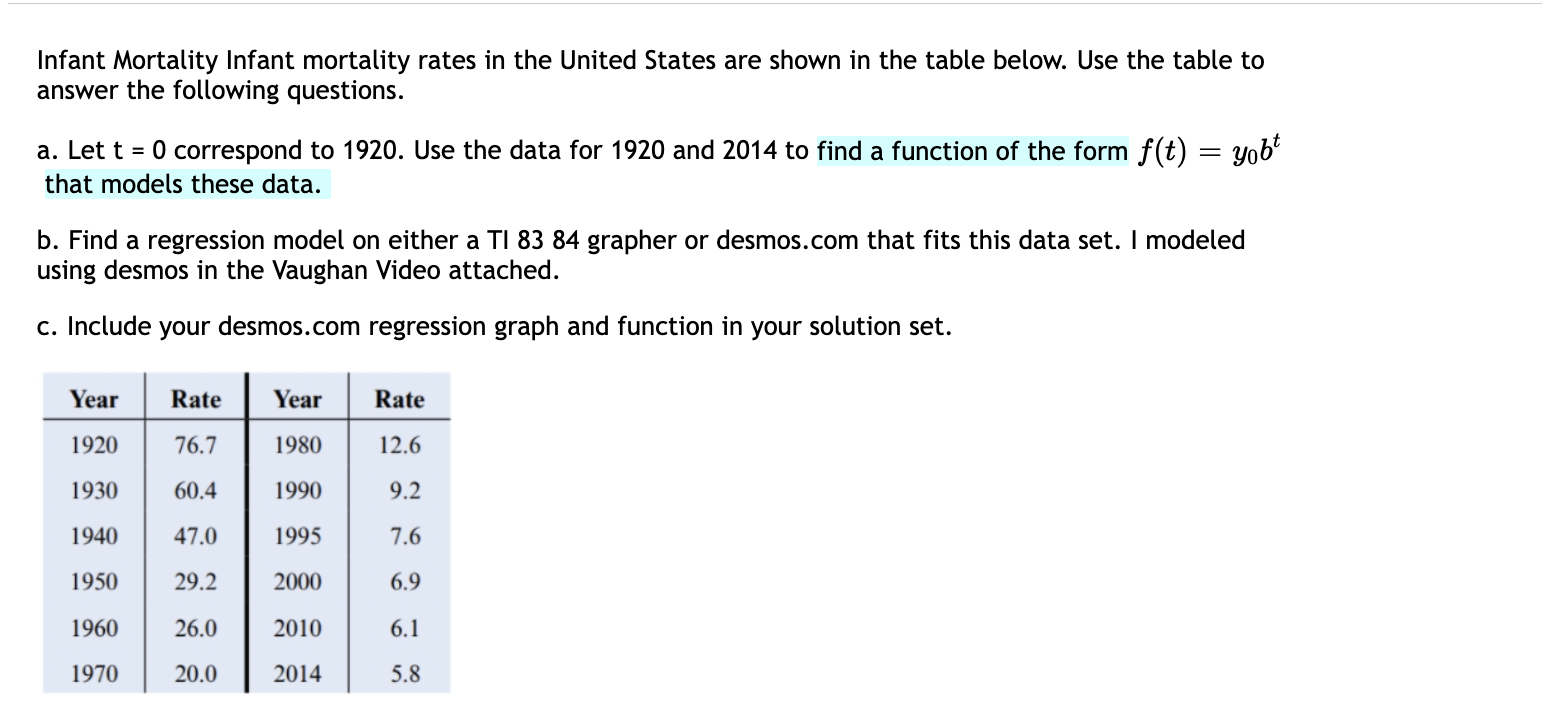
\fR B G K Match each equation with a graph above Video help: https:/ /www.youtube.com/watch?v=OAUWC3xgeAc - 4(1.18)" a. blue (B) 3 (1.18) b. orange (0) - v 4(0.73)2 c. green (G) - 4(1.59)* d. black (K) - v 4(0.82) 2 e. red (R)Given the exponential functions, it\") = 2\"\" 906) = - 2\" = er 3'03) = 2'3 a) Construct a table of values with a domain of [ 4, 4] as modeled below and complete the range outputs for each function. b) Graph the function on desmos.com and verify that your coordinates are on the graph. c) Graph all the functions on the same set of axes (on desmos) to analyze them as an exponential "family." (1. What do you notice about h(m) and at) ? Include your table of values and your graph as a jpg or pdf link. 20 15 1D ,10. ,15 Given the functions below: f (m) = 2""2 Note: This is base 2 to the power of (352 ) g(:1:) = 21:2 Note: This is negative base 2 to the power of (552 ) 2 Mrs) = 2 '3 Note: This is base 2 to the power of ( m2 ) j(a:) : 2' '32 Note: This is negative base 2 to the power of ( 3:2 ) 3) Construct a table of values with a domain from [ 4, 4] and compute outputs for each function. b) On the same set of axes, graph all four functions. What patterns do you notice, there is not a right or wrong answer, rather, what do you see as you graph the functions. b) On the same set of axes, graph the mctions. Total debt: In a certain country, the amount of debt across all sectors (in billions of dollars) can be approximated by the exponential function f) : yo .80.086t ,where t is time in years, and t=0 corresponds to the year 2000. a) Givenf(0) is 2500 (in billions) find the equation that models this function, use part b to write it. b) In the equation replace 90 with the initial debt of 2500. Now, write the exponential function that models this situation. c) If the total debt was 2500 billion in the year 2000 (year 0), find the total amount of debt for 2010. d) If the total debt was 2500 billion in the year 2000 {year 0), find the total amount of debt for 2021. e) Use desmos.com to graph the function and verify that your answers (coordinates) are on the graph. Video support: https:Hscreencast-o-matic.com/watchlc3nfegVDth $ Investment Properties: During the years from 2004 to 2012 ( shortly before, during, and after the recession years of 2007 to 2009), the number of single family investment properties decreased at a rate that can be modeled well by an exponential function. The number of single-family investment properties sold (in thousands) can be approximated by the function g($):1260-e0-22$ , where x = 0 corresponds to the year 2004. (a) Find the number of houses sold in 2007. (a) Find the number of houses sold in 2012. c) What was the first full year in which the number of investment houses sold fell below 400 thousand? d) Use a graphing calculator or desmos.com to graph the function and include your graph. Video support: https:Hscreencast-o-matic.com/watch/c3nfreV05xj $ When money is placed in a bank account that pays compound interest, the amount in the account grows exponentiaLly. Suppose such an account grows from $5000 to $7969 in 8 years. a. Find a growth function of the form ft) : yo bi that gives the amount in the account at time 1', years. b. How much is in the account after 18 years? c. Using desmos.com, construct a model of your function rule that includes the ordered pairs you found. Include the graph as part of your solution. Infant Mortality Infant mortality rates in the United States are shown in the table below. Use the table to answer the following questions. a. Let t = 0 correspond to 1920. Use the data for 1920 and 2014 to find a function of the form f(t) = yobt that models these data. b. Find a regression model on either a TI 83 84 grapher or desmos.com that fits this data set. | modeled using desmos in the Vaughan Video attached. c. Include your desmos.com regression graph and function in your solution set
Step by Step Solution
There are 3 Steps involved in it
1 Expert Approved Answer
Step: 1 Unlock
Question Has Been Solved by an Expert!
Get step-by-step solutions from verified subject matter experts
Step: 2 Unlock
Step: 3 Unlock
Students Have Also Explored These Related Mathematics Questions!