

Question: FRED - Expenditure-side Real GDP at Chained Purchasing Power Parities for United States 22M 20M 18M 16M 14M 12M Millions of 2017 U.S. Dollars 10M
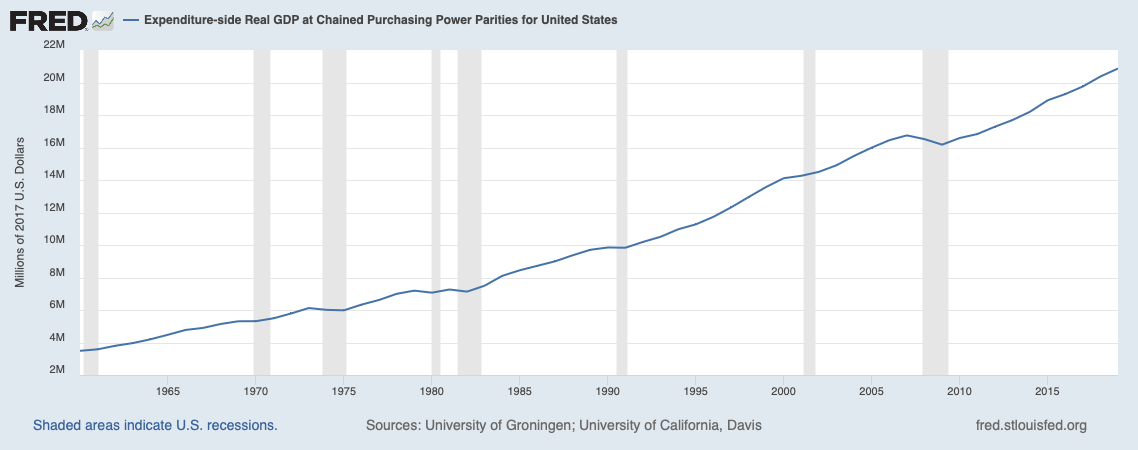
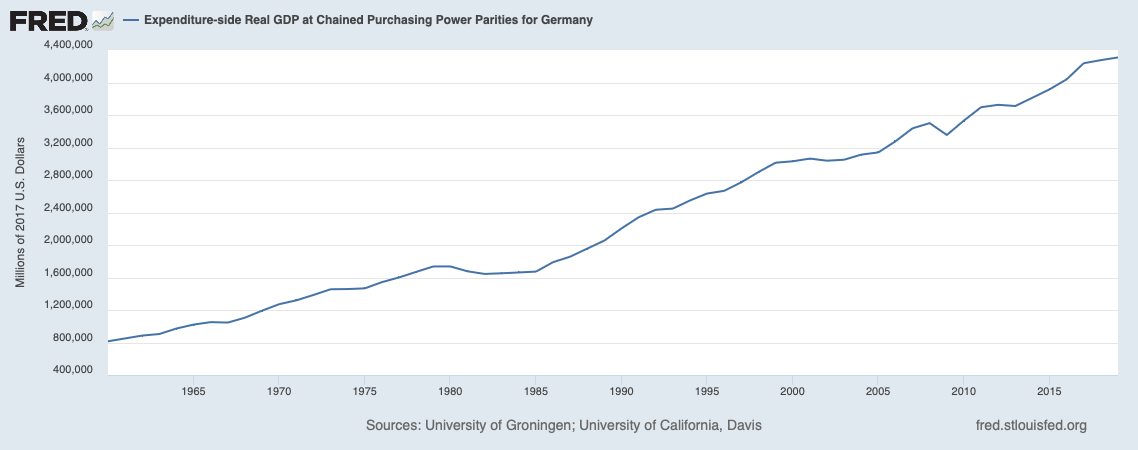
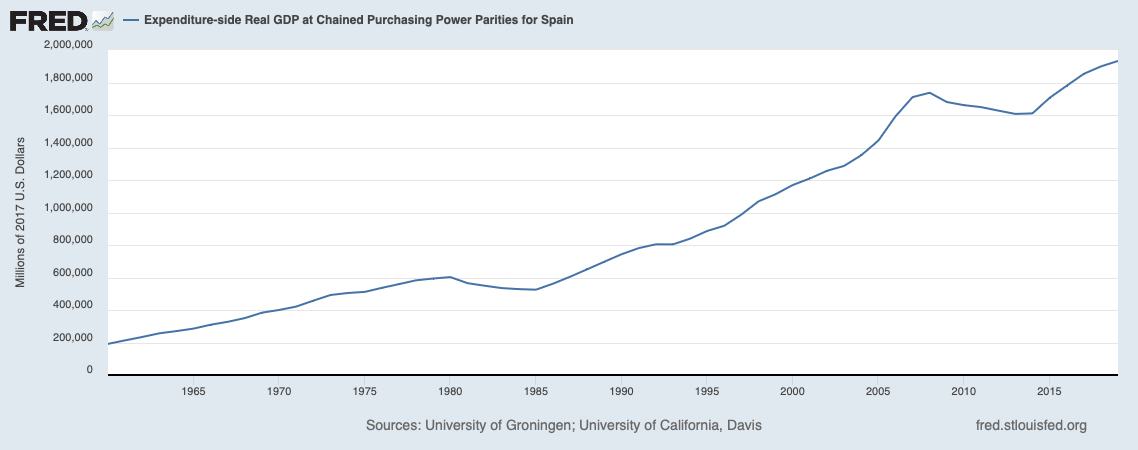
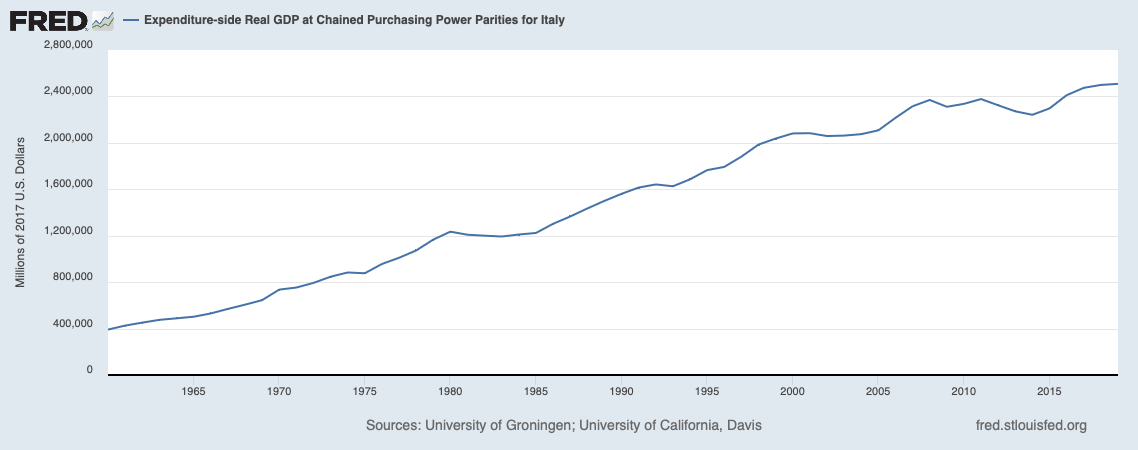
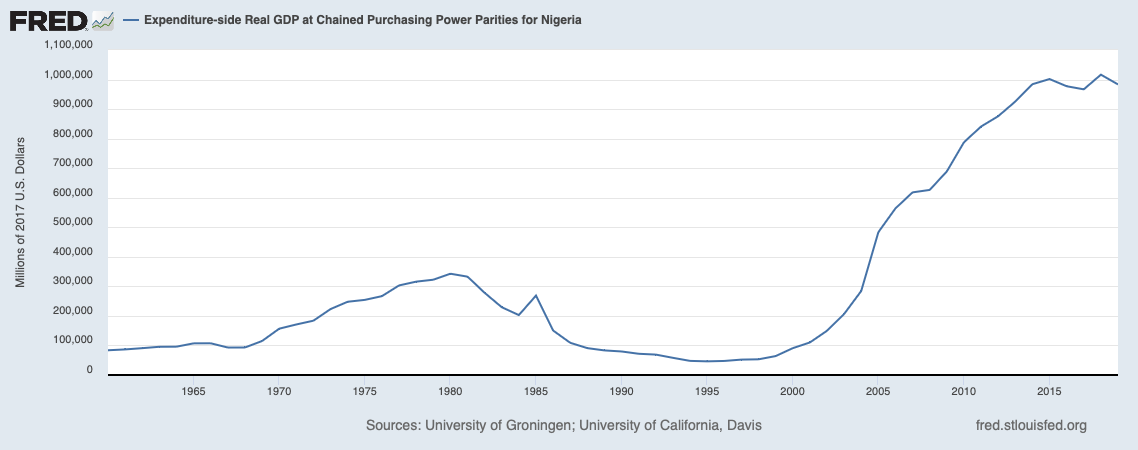
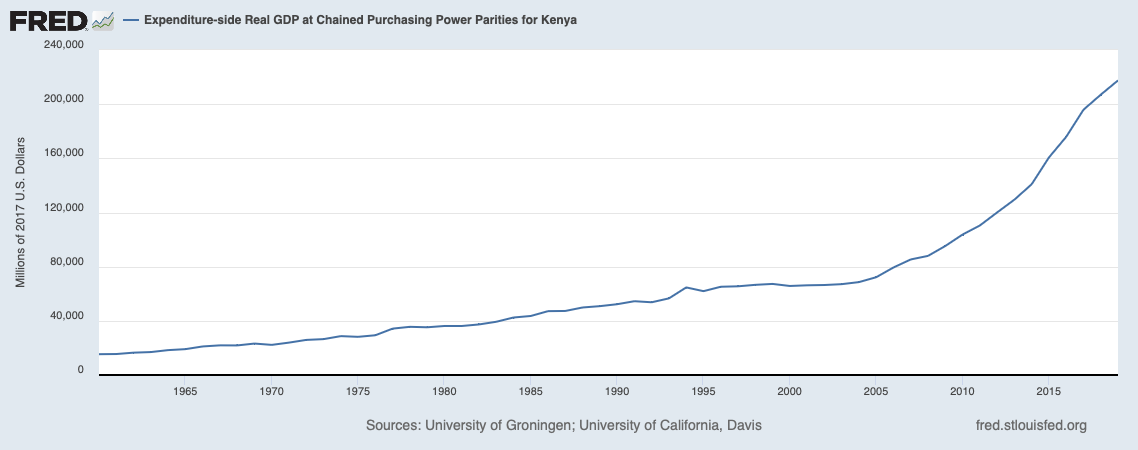
FRED - Expenditure-side Real GDP at Chained Purchasing Power Parities for United States 22M 20M 18M 16M 14M 12M Millions of 2017 U.S. Dollars 10M BM 6M 4M 2M 1965 1970 1975 1980 1985 1990 1995 2000 2005 2010 2015 Shaded areas indicate U.S. recessions. Sources: University of Groningen; University of California, Davis fred.stlouisfed.orgFRED - Expenditure-side Real GDP at Chained Purchasing Power Parities for Germany 4,400,000 4,000,000 3,600,000 3,200,000 2,800,000 2,400,000 Millions of 2017 U.S. Dollars 2,000,000 1,600,000 1,200,000 800,000 400,000 1965 1970 1975 1980 1985 1990 1995 2000 2005 2010 2015 Sources: University of Groningen; University of California, Davis fred.stlouisfed.orgFRED - Expenditure-side Real GDP at Chained Purchasing Power Parities for Spain 2,000,000 1,800,000 1,600,000 1,400,000 1,200,000 1,000,000 Millions of 2017 U.S. Dollars 800,000 600,000 400,000 200,000 1965 1970 1975 1980 1985 1990 1995 2000 2005 2010 2015 Sources: University of Groningen; University of California, Davis fred.stlouisfed.orgFRED - Expenditure-side Real GDP at Chained Purchasing Power Parities for Italy 2,800,000 2,400,000 2,000,000 1,600,000 Millions of 2017 U.S. Dollars 1,200,000 800,000 400,000 0 1965 1970 1975 1980 1985 1990 1995 2000 2005 2010 2015 Sources: University of Groningen; University of California, Davis fred.stlouisfed.orgFRED - Expenditure-side Real GDP at Chained Purchasing Power Parities for Nigeria 1,100,000 1,000,000 900,000 800,000 700,000 600,000 Millions of 2017 U.S. Dollars 500,000 400,000 300,000 200,000 100,000 0 1965 1970 1975 1980 1985 1990 1995 2000 2005 2010 2015 Sources: University of Groningen; University of California, Davis fred.stlouisfed.orgFRED - Expenditure-side Real GDP at Chained Purchasing Power Parities for Kenya 240,000 200,000 160,000 120,000 Millions of 2017 U.S. Dollars 80,000 40,000 1965 1970 1975 1980 1985 1990 1995 2000 2005 2010 2015 Sources: University of Groningen; University of California, Davis fred.stlouisfed.orgQuestion 1 Go to the FRED website (https://fred.stlouisfed.org/) and collect annual data from 1960 to 2019 of the "Expenditure-side Real GDP, at chained purchasing power parity (2017 USD)" for the following 6 countries: US, Italy, Germany, Spain, Kenya, and Nigeria. For the same six countries, and the same time interval, collect data on "Total Population". Using these data, compute real GDP per capita and plot the time series for each country. ii. For each economy, compute the ratio of real GDP per capita relative to that of the US. Do the data support the prediction of convergence? Explain your findings
Step by Step Solution
There are 3 Steps involved in it

Get step-by-step solutions from verified subject matter experts