

Question: Frequency response data for a process including controller are tabulated in Table below. a . Draw the Bode plot by using the given data. b
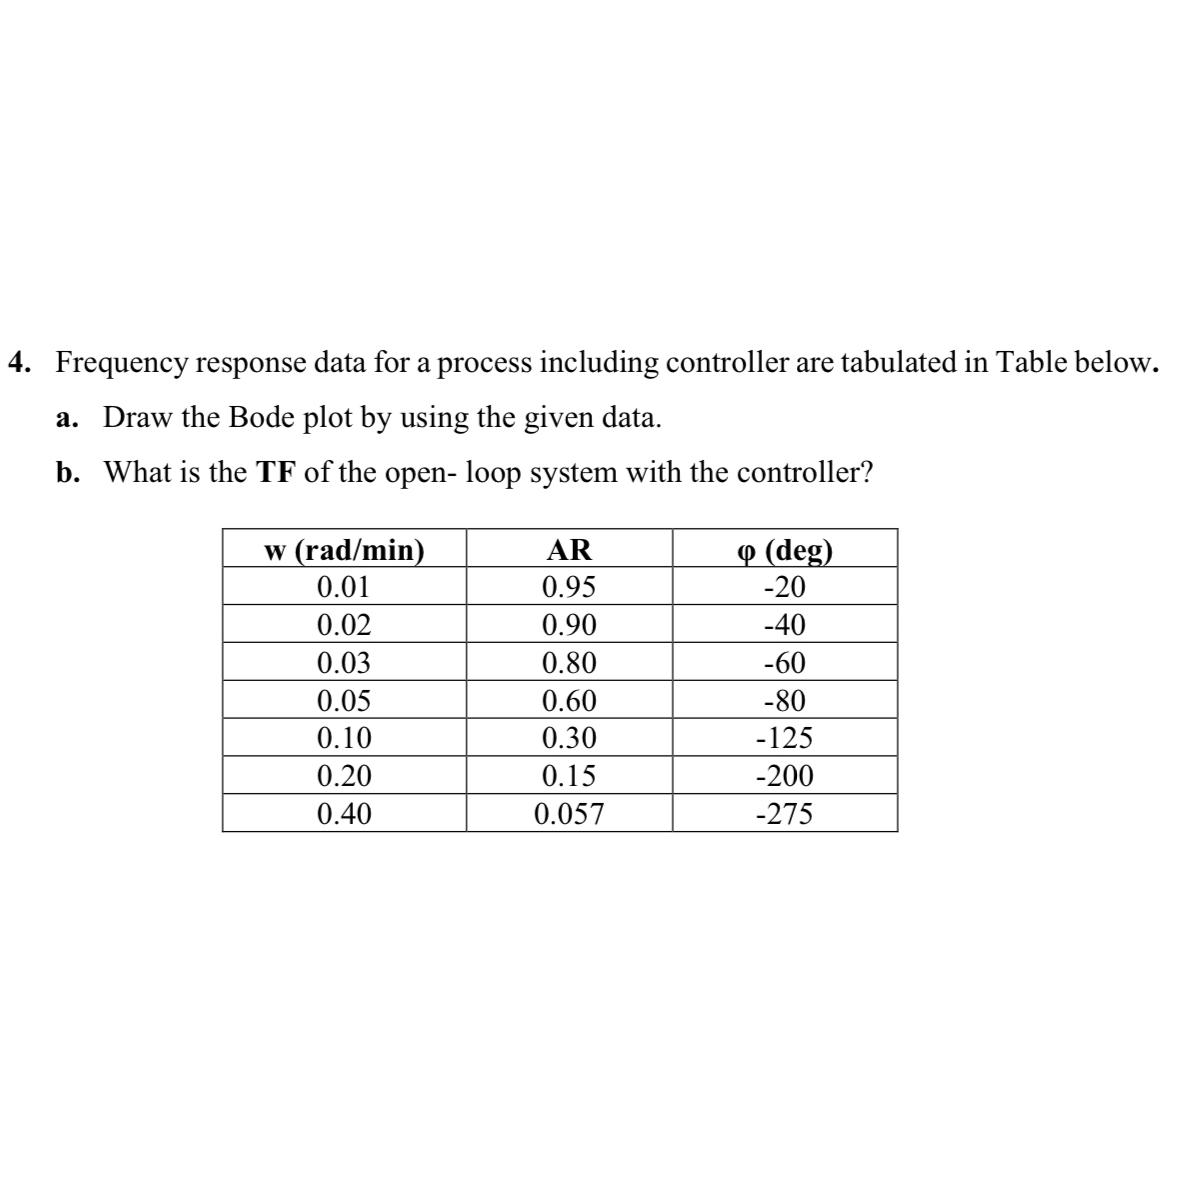
Frequency response data for a process including controller are tabulated in Table below.
a Draw the Bode plot by using the given data.
b What is the TF of the open loop system with the controller?
table
Step by Step Solution
There are 3 Steps involved in it
1 Expert Approved Answer
Step: 1 Unlock

Question Has Been Solved by an Expert!
Get step-by-step solutions from verified subject matter experts
Step: 2 Unlock
Step: 3 Unlock