

Question: From book Artificial Intelligence: A Modern Approach book.chapter 20, problem 1E The data used for Figure 20.1 t can be viewed as being generated by
From book Artificial Intelligence: A Modern Approach book.chapter 20, problem 1E
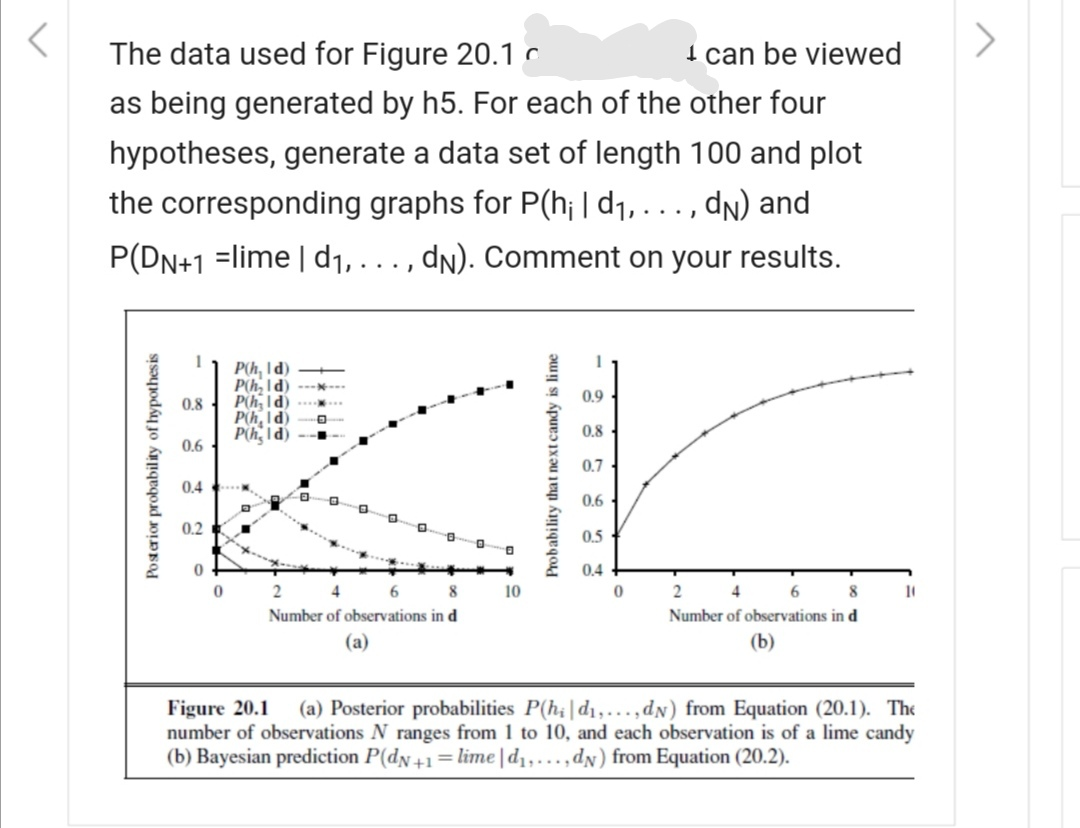
The data used for Figure 20.1 t can be viewed as being generated by h5. For each of the other four hypotheses, generate a data set of length 100 and plot the corresponding graphs for P(hi|d1, ..., dn) and P(DN+1 =lime | d1, ..., dn). Comment on your results. P( hld) PhId Phald Ph. Id Phid) --- Posterior probability of hypothesis Probability that next candy is lime 0 10 10 2 4 6 8 Number of observations in d (a) 2 4 6 8 Number of observations in d (b) Figure 20.1 (a) Posterior probabilities P(hid,...,) from Equation (20.1). The number of observations N ranges from 1 to 10, and each observation is of a lime candy (b) Bayesian prediction P(dx +1 = limed],...,n) from Equation (20.2)
Step by Step Solution
There are 3 Steps involved in it

Get step-by-step solutions from verified subject matter experts