

Question: From: Business Process Modeling, Simulation and Design, by Manuel Laguna and Johan Marklund, Chapman and Hall/CRC; 3rd edition (December 26, 2018) 16. Figure 8.69 shows
From: Business Process Modeling, Simulation and Design, by Manuel Laguna and Johan Marklund, Chapman and Hall/CRC; 3rd edition (December 26, 2018)
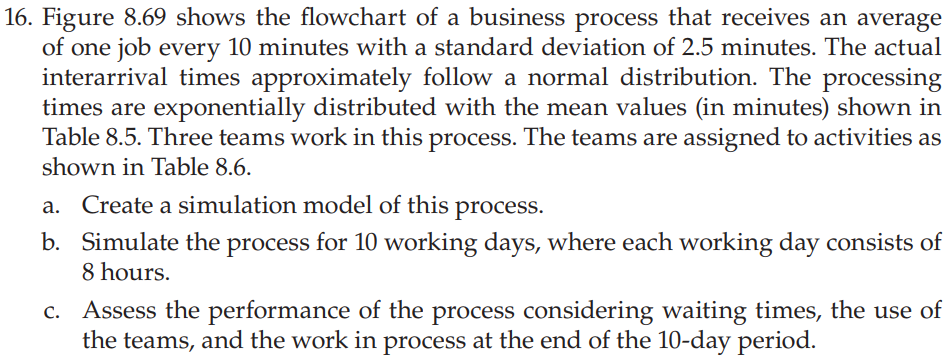
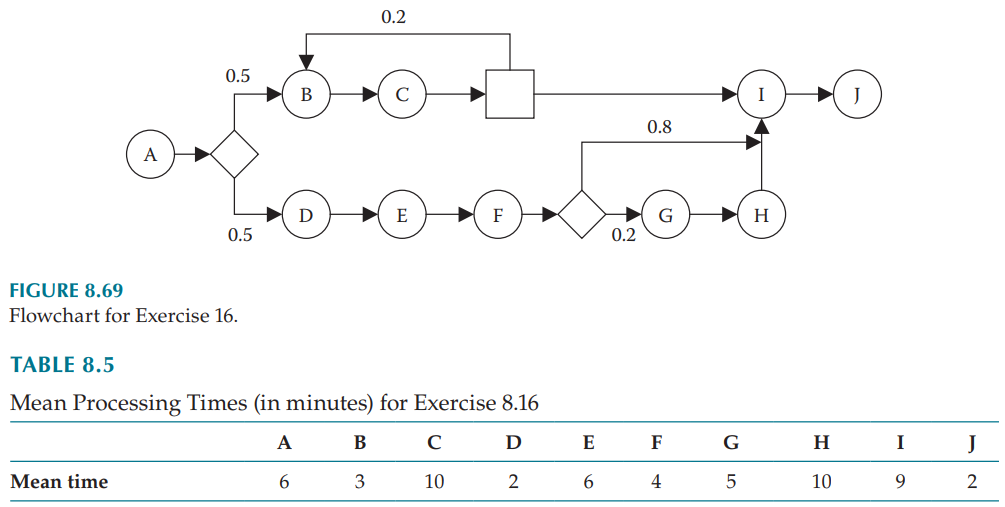
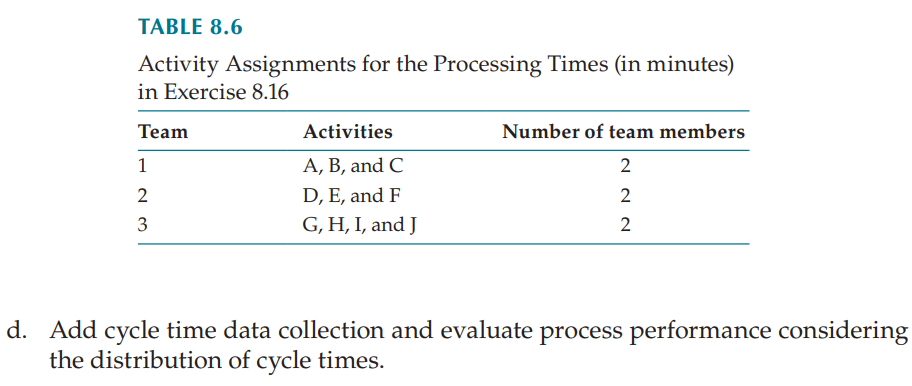
16. Figure 8.69 shows the owchart of a business process that receives an average of one job every 10 minutes with a standard deviation of 2.5 minutes. The actual interarrival times approximately follow a normal distribution. The processing times are exponentially distributed with the mean values (in minutes) shown in Table 8.5. Three teams work in this process. The teams are assigned to activities as shown in Table 8.6. a. Create a simulation model of this process. b. Simulate the process for 10 working days, where each working day consists of 8 hours. c. Assess the performance of the process considering waiting times, the use of the teams, and the work in process at the end of the 10-day period. FIGURE 8.69 Flowchart for ExerciSe 16. TABLE 3.5 Mean Processing Times (in minutes) for Exercise 8.16 A B C D E F G H Mean time 6 3 10 2 6 4 5 10 TABLE 8.6 Activity Assignments for the Processing Times (in minutes) in Exercise 8.16 Team Activities Number of team members 1 A, B, and C 2 2 D, E, and F 2 3 G, H, I, and] 2 d. Add cycle time data collection and evaluate process performance considering the distribution of cycle times
Step by Step Solution
There are 3 Steps involved in it

Get step-by-step solutions from verified subject matter experts