

Question: From given data, report and analyze the PLOT of AVERAGE (or total) profit vs. Q. Please don't forget to analyze it. SIMULATING AN INVENTORY POLICY
From given data, report and analyze the PLOT of AVERAGE (or total) profit vs. Q.
Please don't forget to analyze it.
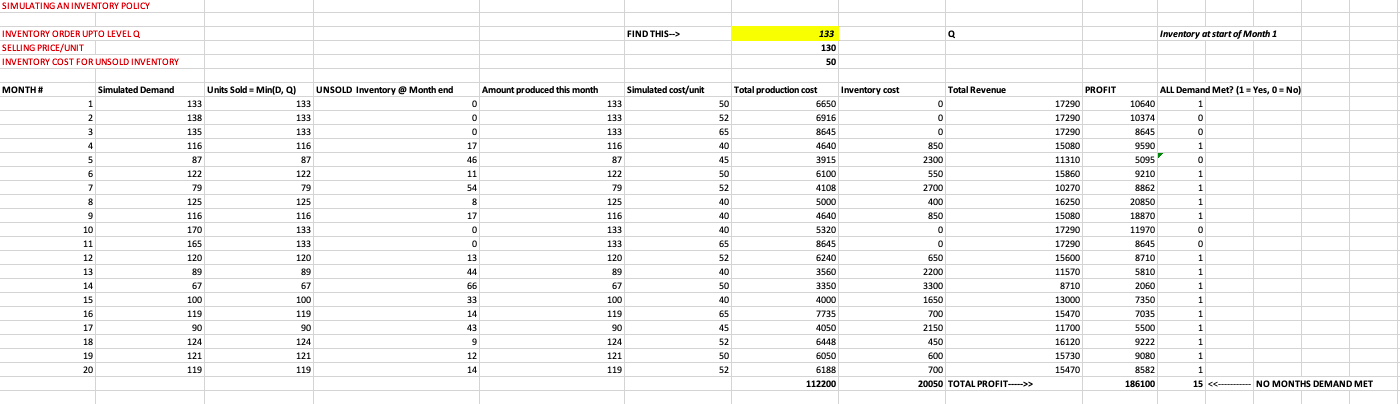
SIMULATING AN INVENTORY POLICY FIND THIS-> 133 Inventory at start of Month 1 INVENTORY ORDER UPTO LEVEL Q SELLING PRICE/UNIT INVENTORY COST FOR UNSOLD INVENTORY 130 50 MONTH # Simulated Demand UNSOLD Inventory @ Month end Amount produced this month Simulated cost/unit inventory cost Total Revenue Units Sold = MiniD,Q) 133 133 0 138 133 133 133 133 0 3 135 133 65 116 116 17 116 87 46 87 122 87 122 79 122 850 2300 550 2700 400 850 8 125 125 125 116 116 170 133 0 Total production cost 6650 6916 8645 4640 3915 6100 4108 5000 4640 5320 8645 6240 3560 3350 4000 7735 4050 6448 6050 6188 112200 116 133 133 120 89 PROFIT 17290 17290 17290 15080 11310 15860 10270 16250 15080 17290 17290 15600 11570 8710 13000 15470 11700 16120 15730 15470 165 120 133 120 ALL Demand Met? (1 = Yes, 0 = No) 106401 10374 0 8645 9590 5095 9210 8862 20850 18870 11970 8645 8710 1 5810 2060 7350 7035 5500 9222 9080 8582 186100 15 > 119 90 124 121 119 19 12 14 20 SIMULATING AN INVENTORY POLICY FIND THIS-> 133 Inventory at start of Month 1 INVENTORY ORDER UPTO LEVEL Q SELLING PRICE/UNIT INVENTORY COST FOR UNSOLD INVENTORY 130 50 MONTH # Simulated Demand UNSOLD Inventory @ Month end Amount produced this month Simulated cost/unit inventory cost Total Revenue Units Sold = MiniD,Q) 133 133 0 138 133 133 133 133 0 3 135 133 65 116 116 17 116 87 46 87 122 87 122 79 122 850 2300 550 2700 400 850 8 125 125 125 116 116 170 133 0 Total production cost 6650 6916 8645 4640 3915 6100 4108 5000 4640 5320 8645 6240 3560 3350 4000 7735 4050 6448 6050 6188 112200 116 133 133 120 89 PROFIT 17290 17290 17290 15080 11310 15860 10270 16250 15080 17290 17290 15600 11570 8710 13000 15470 11700 16120 15730 15470 165 120 133 120 ALL Demand Met? (1 = Yes, 0 = No) 106401 10374 0 8645 9590 5095 9210 8862 20850 18870 11970 8645 8710 1 5810 2060 7350 7035 5500 9222 9080 8582 186100 15 > 119 90 124 121 119 19 12 14 20
Step by Step Solution
There are 3 Steps involved in it

Get step-by-step solutions from verified subject matter experts