

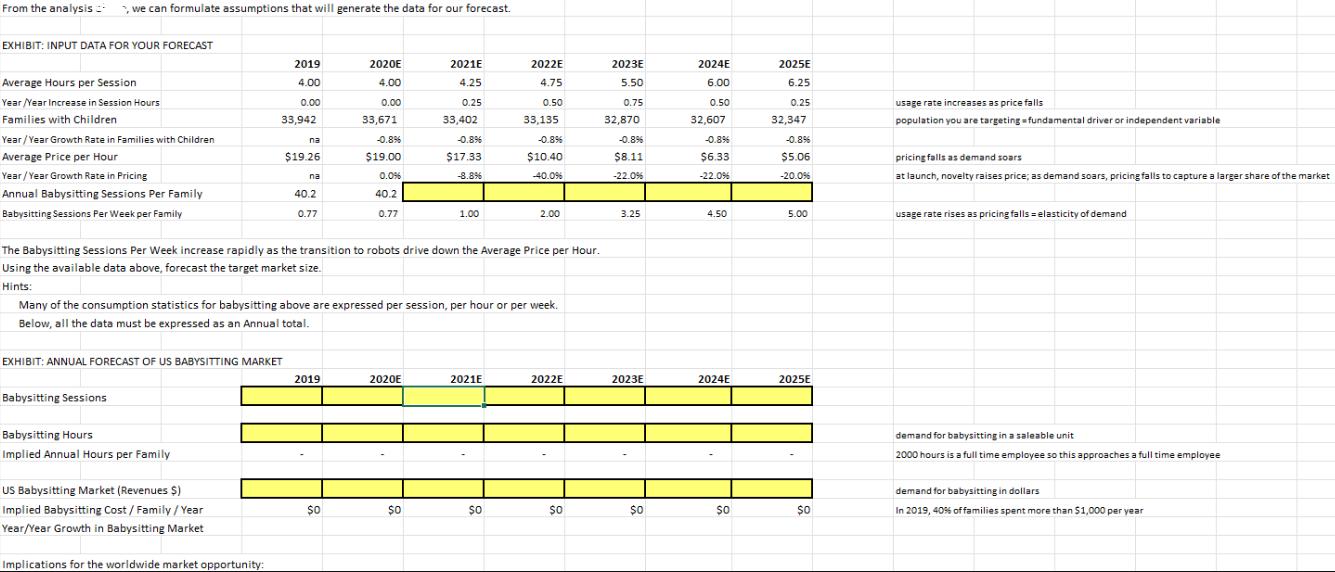
From the analysis we can formulate assumptions that will generate the data for our forecast. EXHIBIT:...
Fantastic news! We've Found the answer you've been seeking!
Question:
Expert Answer:
Annual Forecast of US Babysitting Market Based on the provided data and hints heres the annual forecast of the US Babysitting Market Assumptions The yearonyear growth rate in families with children re... View the full answer

Related Book For 

Financial Reporting Financial Statement Analysis and Valuation a strategic perspective
ISBN: 978-1337614689
9th edition
Authors: James M. Wahlen, Stephen P. Baginski, Mark Bradshaw
Posted Date:
