

Question: From the attached spreadsheet titled P3 - Use Excel to generate a trend line of Sales on TimeUnit, What is the fitted equation? - Use
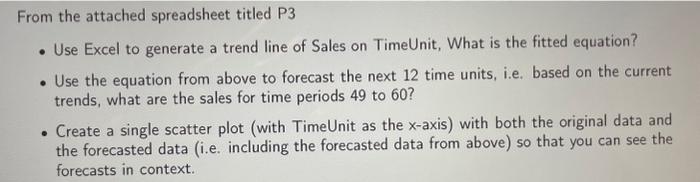
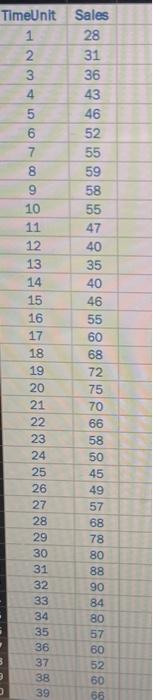
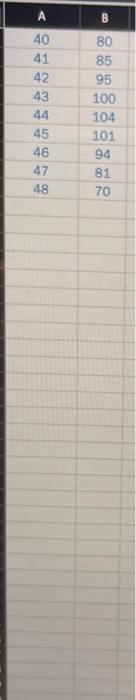
From the attached spreadsheet titled P3 - Use Excel to generate a trend line of Sales on TimeUnit, What is the fitted equation? - Use the equation from above to forecast the next 12 time units, i.e. based on the current trends, what are the sales for time periods 49 to 60 ? - Create a single scatter plot (with TimeUnit as the x-axis) with both the original data and the forecasted data (i.e. including the forecasted data from above) so that you can see the forecasts in context. \begin{tabular}{|c|c|} \hline TimeUnit & Sales \\ \hline 1 & 28 \\ \hline 2 & 31 \\ \hline 3 & 36 \\ \hline 4 & 43 \\ \hline 5 & 46 \\ \hline 6 & 52 \\ \hline 7 & 55 \\ \hline 8 & 59 \\ \hline 9 & 58 \\ \hline 10 & 55 \\ \hline 11 & 47 \\ \hline 12 & 40 \\ \hline 13 & 35 \\ \hline 14 & 40 \\ \hline 35 \\ \hline 36 & 46 \\ \hline 39 & 60 \\ \hline 16 & 55 \\ \hline 17 & 60 \\ \hline 18 & 68 \\ \hline 19 & 72 \\ \hline 20 & 75 \\ \hline 21 & 70 \\ \hline 22 & 66 \\ \hline 23 & 58 \\ \hline 24 & 50 \\ \hline 25 & 45 \\ \hline 26 & 49 \\ \hline 27 & 57 \\ \hline 28 & 68 \\ \hline 29 & 78 \\ \hline 30 & 80 \\ \hline 31 & 88 \\ \hline 32 & 90 \\ \hline \hline \\ \hline \hline \end{tabular}
Step by Step Solution
There are 3 Steps involved in it

Get step-by-step solutions from verified subject matter experts