

Question: from the data above, I need to create the following ratios. Liquidity Ratios Current Ratio Quick Ratio Leverage Ratios Debt to Total Assets Ratio Debt
- from the data above, I need to create the following ratios.
- Liquidity Ratios
- Current Ratio
- Quick Ratio
- Leverage Ratios
- Debt to Total Assets Ratio
- Debt Equity Ratio
- Long-Term Debt to Equity
- Times Interest Earned Ratio
- Activity Ratios
- Inventory Turnover
- Fixed Assets Turnover
- Total Assets Turnover
- Accounts Receivable Turnover
- Average Collection Period
- Profitability Ratios
- Gross Profit Margin
- Operating Profit Margin
- Net Profit Margin
- Return on Total Assets (ROA)
- Return on Stockholders Equity (ROE)
- Earnings Per Share (EPS)
- Price Earnings Ratio
- Liquidity Ratios
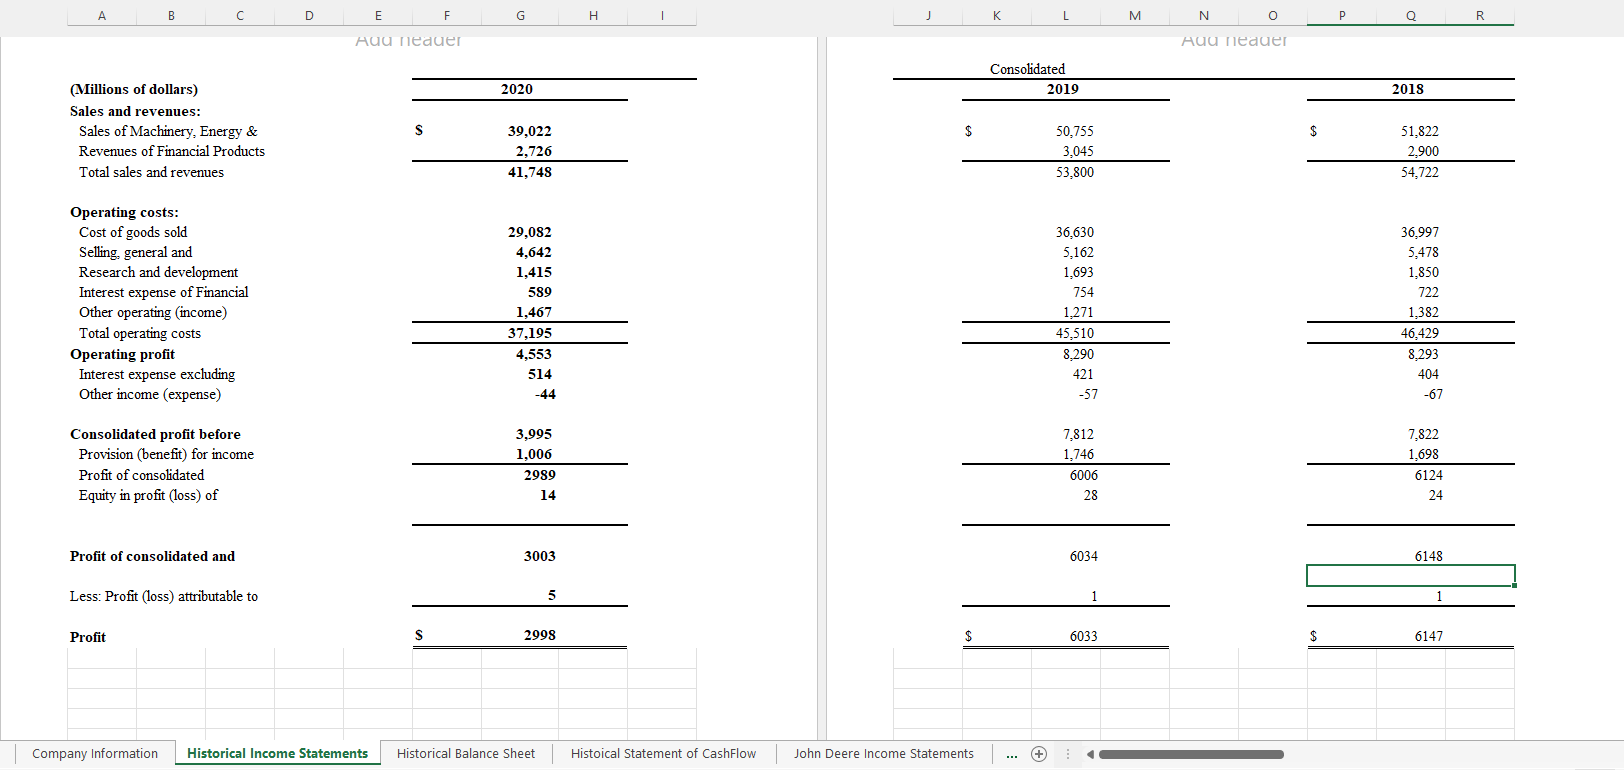
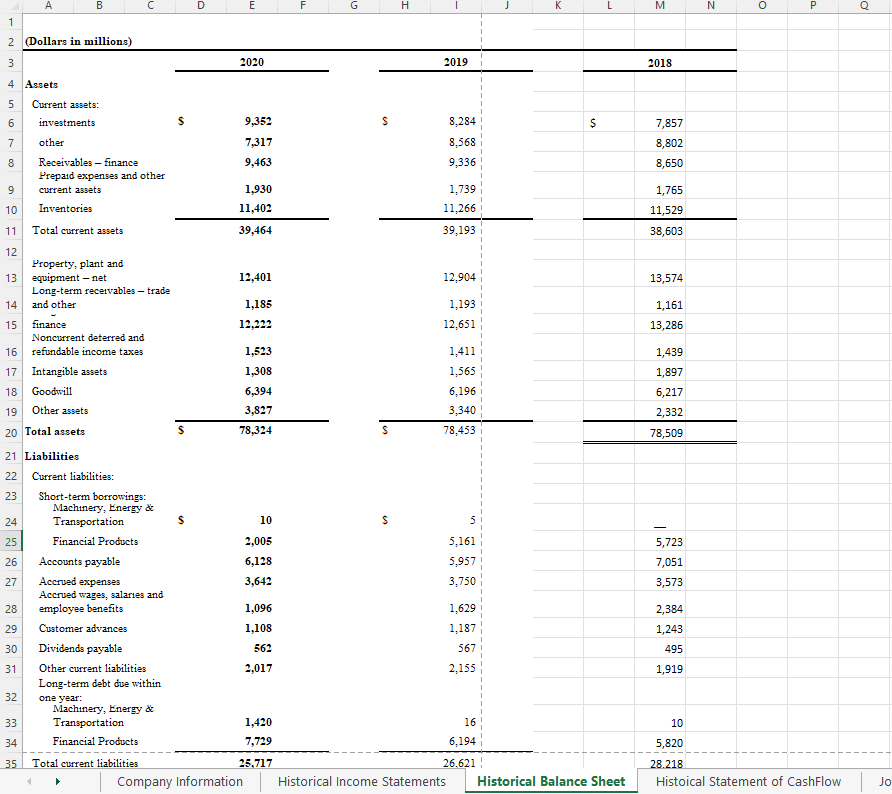
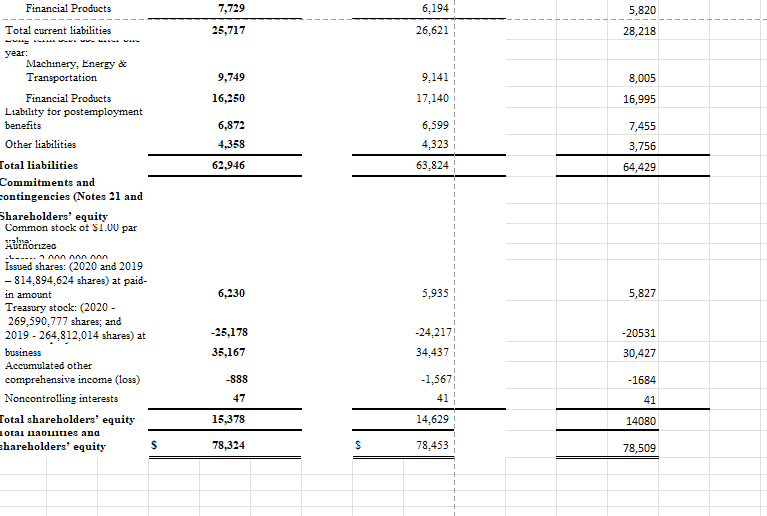
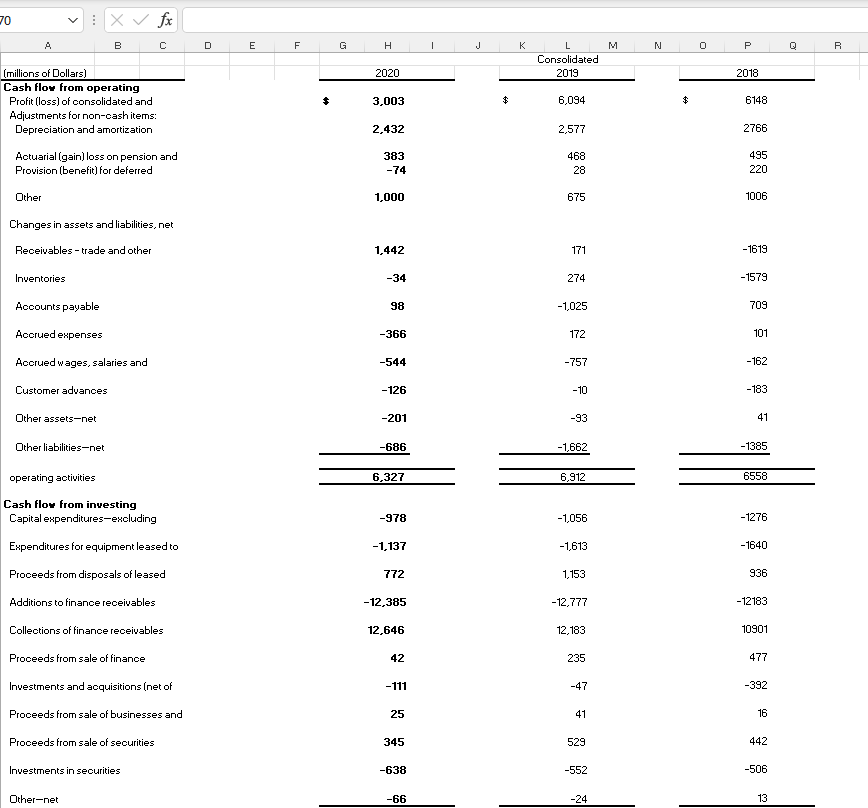
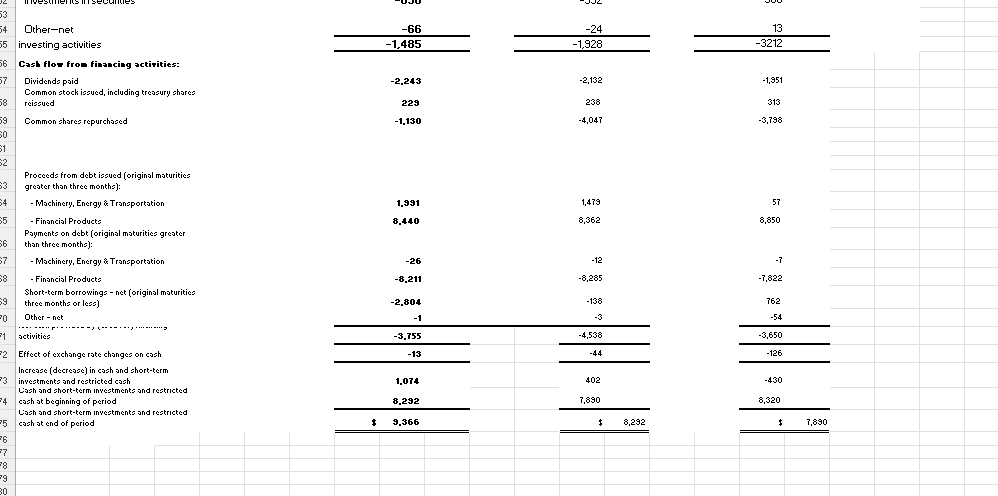
B D E F G H K L M N Q R Auu neauer Aud neauer Consolidated 2019 2020 2018 (Millions of dollars) Sales and revenues: Sales of Machinery, Energy & Revenues of Financial Products Total sales and revenues S $ $ 39,022 2,726 41,748 50,755 3,045 53,800 51,822 2.900 54,722 Operating costs: Cost of goods sold Selling, general and Research and development Interest expense of Financial Other operating (income) Total operating costs Operating profit Interest expense excluding Other income (expense) 29,082 4,642 1,415 589 1,467 37,195 4,553 514 -44 36,630 5,162 1,693 754 1,271 45.510 8,290 421 -57 36,997 5,478 1,850 722 1,382 46,429 8,293 404 -67 Consolidated profit before Provision (benefit) for income Profit of consolidated Equity in profit (loss) of 3,995 1,006 2989 14 7.812 1,746 6006 28 7,822 1,698 6124 24 Profit of consolidated and 3003 6034 6148 Less: Profit (loss) attributable to 5 1 1 Profit S 2998 6033 $ 6147 Company Information Historical Income Statements Historical Balance Sheet Histoical Statement of CashFlow John Deere Income Statements B U D E F H J K L M N P 1 2 (Dollars in millions) 3 2020 2019 2018 S $ 7,857 4 Assets 5 Current assets: 6 investments 7 other 8 Receivables - finance Prepaid expenses and other 9 current assets 10 Inventories 9,352 7,317 8,284 8,568 9,336 8,802 8 - 9,463 8,650 1,765 1,930 11,402 39,464 1,739 11,266 39,193 11,529 11 Total current assets 38,603 12,401 12,904 13,574 1,185 12,222 1,193 12,651 1,161 13,286 12 Property, plant and 13 equipment - net Long-term receivables - trade 14 and other 15 finance Noncurrent deterred and 16 refundable income taxes 17 Intangible assets 18 Goodwill 19 Other assets 20 Total assets 1,523 1,439 1,308 6,394 3,827 78,324 1,411 1,565 6,196 3,340 78,453 1,897 6,217 2,332 78,509 $ $ 23 S 10 S 5,723 2,005 6,128 5,161 5,957 3,750 7,051 3,573 3,642 21 Liabilities 22 Current liabilities: Short-term borrowings: Machinery, Energy & 24 Transportation 25 Financial Products 26 Accounts payable 27 Accrued expenses Accrued wages, salaries and 28 employee benefits 29 Customer advances 30 Dividends payable 31 Other current liabilities Long-term debt due within 32 one year: Machinery, Energy & 33 Transportation 34 Financial Products 2,384 1,096 1,108 1,243 1,629 1,187 567 2,155 562 495 2,017 1,919 10 1,420 7,729 16 6,194 5,820 35 Total current liabilities 25.717 Company Information 26.621 Historical Income Statements Historical Balance Sheet 28.218 Histoical Statement of CashFlow Jo Financial Products 7,729 5,820 6,194 26,621 Total current liabilities 25,717 28,218 9,749 9,141 8,005 16,995 16,250 17,140 6,872 4,358 6,599 4,323 63,824 7,455 3,756 62,946 64,429 alus year: Machinery, Energy & Transportation Financial Products Liability for postemployment benefits Other liabilities Total liabilities Commitments and contingencies (Notes 21 and Shareholders' equity Common stock of $1.00 par Kironized Issued shares: (2020 and 2019 - 814,894,624 shares) at paid- in amount Treasury stock: (2020- 269,590,777 shares; and 2019 - 264,812,014 shares) at business Accumulated other comprehensive income (loss) Noncontrolling interests Total shareholders' equity otal llaties ana Shareholders' equity S -1 ----AAAAAAAAA 6,230 5,935 5,827 - -20531 -25,178 35,167 -24,217 34,437 30,427 -888 -1684 -1,567 41 47 41 15,378 14,629 14080 78,324 S 78,453 78,509 20 1 X fx A B D E F G H 1 J M N 0 P R K L Consolidated 2019 2020 2018 (millions of Dollars) Cash flow from operating Profit (loss) of consolidated and Adjustments for non-oash items: Depreciation and amortization 3,003 $ 6,094 $ 6148 2,432 2,577 2766 495 Actuarial (gain) loss on pension and Provision (benefit) for deferred 383 -74 468 28 220 Other 1,000 675 1006 Changes in assets and liabilities, net Receivables - trade and other 1,442 171 -1619 Inventories -34 274 -1579 Accounts payable 98 -1,025 709 Accrued expenses -366 172 101 Accrued wages, salaries and -544 -757 - 162 Customer advances -126 -10 -183 Other assets-net -201 -93 41 Other liabilities-net -686 -1,662 -1385 operating activities 6,327 6,912 6558 Cash flow from investing Capital expenditures-excluding -978 -1,056 -1276 Expenditures for equipment leased to -1,137 -1,613 -1640 Proceeds from disposals of leased 772 1,153 936 Additions to finance receivables -12,385 -12,777 -12183 12,646 12,183 10901 42 235 477 Collections of finance receivables Proceeds from sale of finance Investments and acquisitions (net of Proceeds from sale of businesses and Proceeds from sale of securities -111 -47 -392 25 41 16 345 529 442 Investments in securities -638 -552 -506 Other-net -66 -24 13 -66 -1,485 -24 -1,928 13 -3212 -2.243 -2,132 -1.951 229 238 313 -1,130 -4.047 -3.798 53 54 Other-net 55 investing activities 56 Cash flow fros financing activities: 57 Dividends paid Common stock issued, including tresury shares 58 reissued 59 Common bhores repurchased 50 81 2 Proceeds from debt issued (original maturities 83 greater than three months): 34 Machinery, Energy & Transportation 55 - Financial Producto Payments on debt (original maturities greater 56 than three months) 57 - Machinery, Energy & Transportation 58 - Financial Products Short-term borrowings-net (original maturities 59 three months or less) 20 Othernet -------------............... F1 activities 1.991 57 1,479 8,362 8.440 8,850 -26 -12 -7 -8.211 -8,285 -7,822 -138 762 -2.804 -1 -54 -3.755 -4,538 -3,650 -13 -44 -126 -1 1,074 402 -430 8.292 7,890 2 Effect of exchange rate changes on cash Increase (decrease) in cash and short-term 3 investments and restricted cash Cash and short-term investments and restricted -4 cash at beginning of period Cash and short-term investments and restricted -5 cash at end of period 26 +7 =8 29 30 8,320 $ 9,366 8,292 7,890
Step by Step Solution
There are 3 Steps involved in it

Get step-by-step solutions from verified subject matter experts