

Question: From the figure, the measurement and data collection processes are the same. Calculate the reproducibility standard deviation, Dispersion of data, and the best value to
From the figure, the measurement and data collection processes are the same.
Calculate the reproducibility standard deviation, Dispersion of data, and the best value to measure.
Please show the solution to the problem in detail.
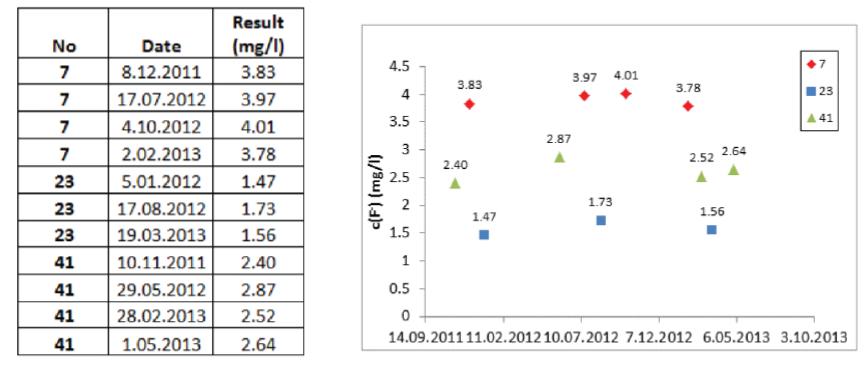
No 7 7 7 7 23 23 23 41 41 41 41 Result Date (mg/l) 3.83 8.12.2011 17.07.2012 3.97 4.10.2012 4.01 2.02.2013 3.78 5.01.2012 1.47 17.08.2012 1.73 19.03.2013 1.56 10.11.2011 2.40 29.05.2012 2.87 28.02.2013 2.52 1.05.2013 2.64 c(F) (mg/l) 4.5 4 3.5 3 3.83 2.40 2.87 1.47 3.97 4.01 3.78 1.73 2.52 2.64 7 2.5 2 1.5 1 0.5 0 14.09.2011 11.02.2012 10.07.2012 7.12.2012 6.05.2013 3.10.2013 1.56 123 A 41
Step by Step Solution
3.39 Rating (161 Votes )
There are 3 Steps involved in it

Get step-by-step solutions from verified subject matter experts