

Question: From the information below what conclusion can be drawn from the figures below The aim of this systematic review is to assess the effects of
From the information below what conclusion can be drawn from the figures below The aim of this systematic review is to assess the effects of post-arrest court mandated interventions...for domestic violence offenders...with the aim of reducing their future likelihood of re-assaulting above and beyond what would have been expected by routine legal procedures.We searched numerous computerized databases and websites, bibliographies of published reviews of related literature and scrutiny of annotated bibliographies of related literature. Our goal was to identify all published and unpublished literature that met our selection criteria......For...experimental...designs, control conditions could be no-treatment, or treatment as usual. That is, the no-treatment control condition could include routine legal interventions such as probation or a short jail stay...This systematic review used standard meta-analytic methods... Effects measured on continuous type measures...were encoded as standardized mean difference type effect sizes (d)...p.148Official reports were either official complaints made to the police that may or may not have resulted in an arrest, or actual arrests for domestic violence...Figure 1 indicates a general pattern of positive effects on official reports of repeat victimization in these experimental studies...Victim Reported Outcomes: A concern with official measures is that they may not accurately reflect the amount and severity of on-going violence. Research consistently indicates that official reports capture only a small fraction of this abuse...As such, the victim is viewed as the best source for information on the offender's continued abuse. Given that, we turn our attention to the...estimates we have from these studies on the effect of these programs according to the victim's reports of abuse...The distribution of effects is shown in Figure 4.
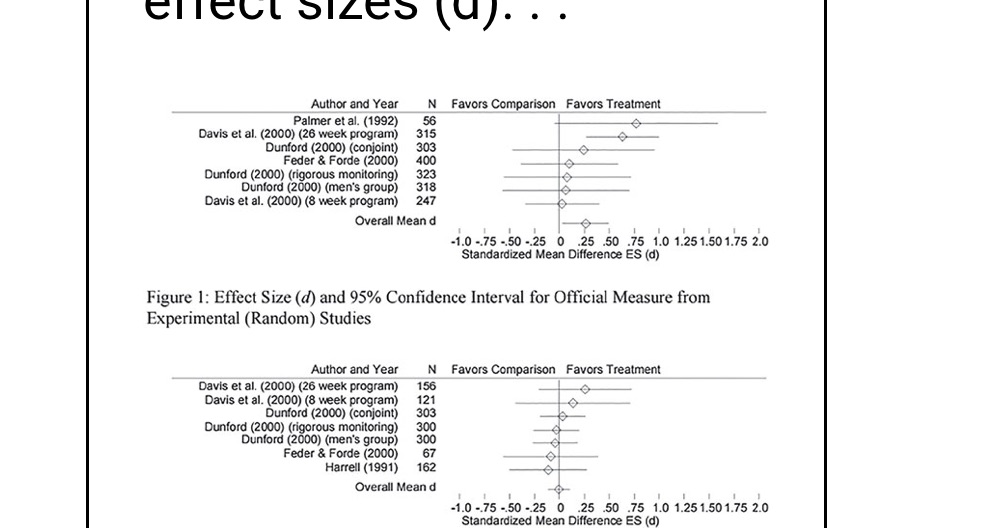
cleCL SIZES (U) . . . Author and Year N Favors Comparison Favors Treatment Palmer et al. (1992) 56 Davis et al. (2000) (26 week program) 315 Dunford (2000) (conjoint) 303 Feder & Forde (2000) 400 Dunford (2000) (rigorous monitoring) 323 Dunford (2000) (men's group) 318 Davis et al. (2000) (8 week program) 247 Overall Mean d -1.0 -.75 -50 -.25 0 .25 .50 .75 1.0 1.25 1.50 1.75 2.0 Standardized Mean Difference ES (d) Figure 1: Effect Size (d) and 95% Confidence Interval for Official Measure from Experimental (Random) Studies Author and Year N Favors Comparison Favors Treatment Davis et al. (2000) (26 week program) 156 Davis et al. (2000) (8 week program) 121 Dunford (2000) (conjoint) 303 Dunford (2000) (rigorous monitoring) 300 Dunford (2000) (men's group) 300 Feder & Forde (2000) 67 Harrell (1991) 162 Overall Mean d -1.0 -.75 -50 -.25 0 .25 .50 .75 1.0 1.25 1.50 1.75 2.0 Standardized Mean Difference ES (d)
Step by Step Solution
There are 3 Steps involved in it

Get step-by-step solutions from verified subject matter experts