

Question: From the soil profile shown, a sample was taken from pt . A with w = 3 1 % and G s = 2 .
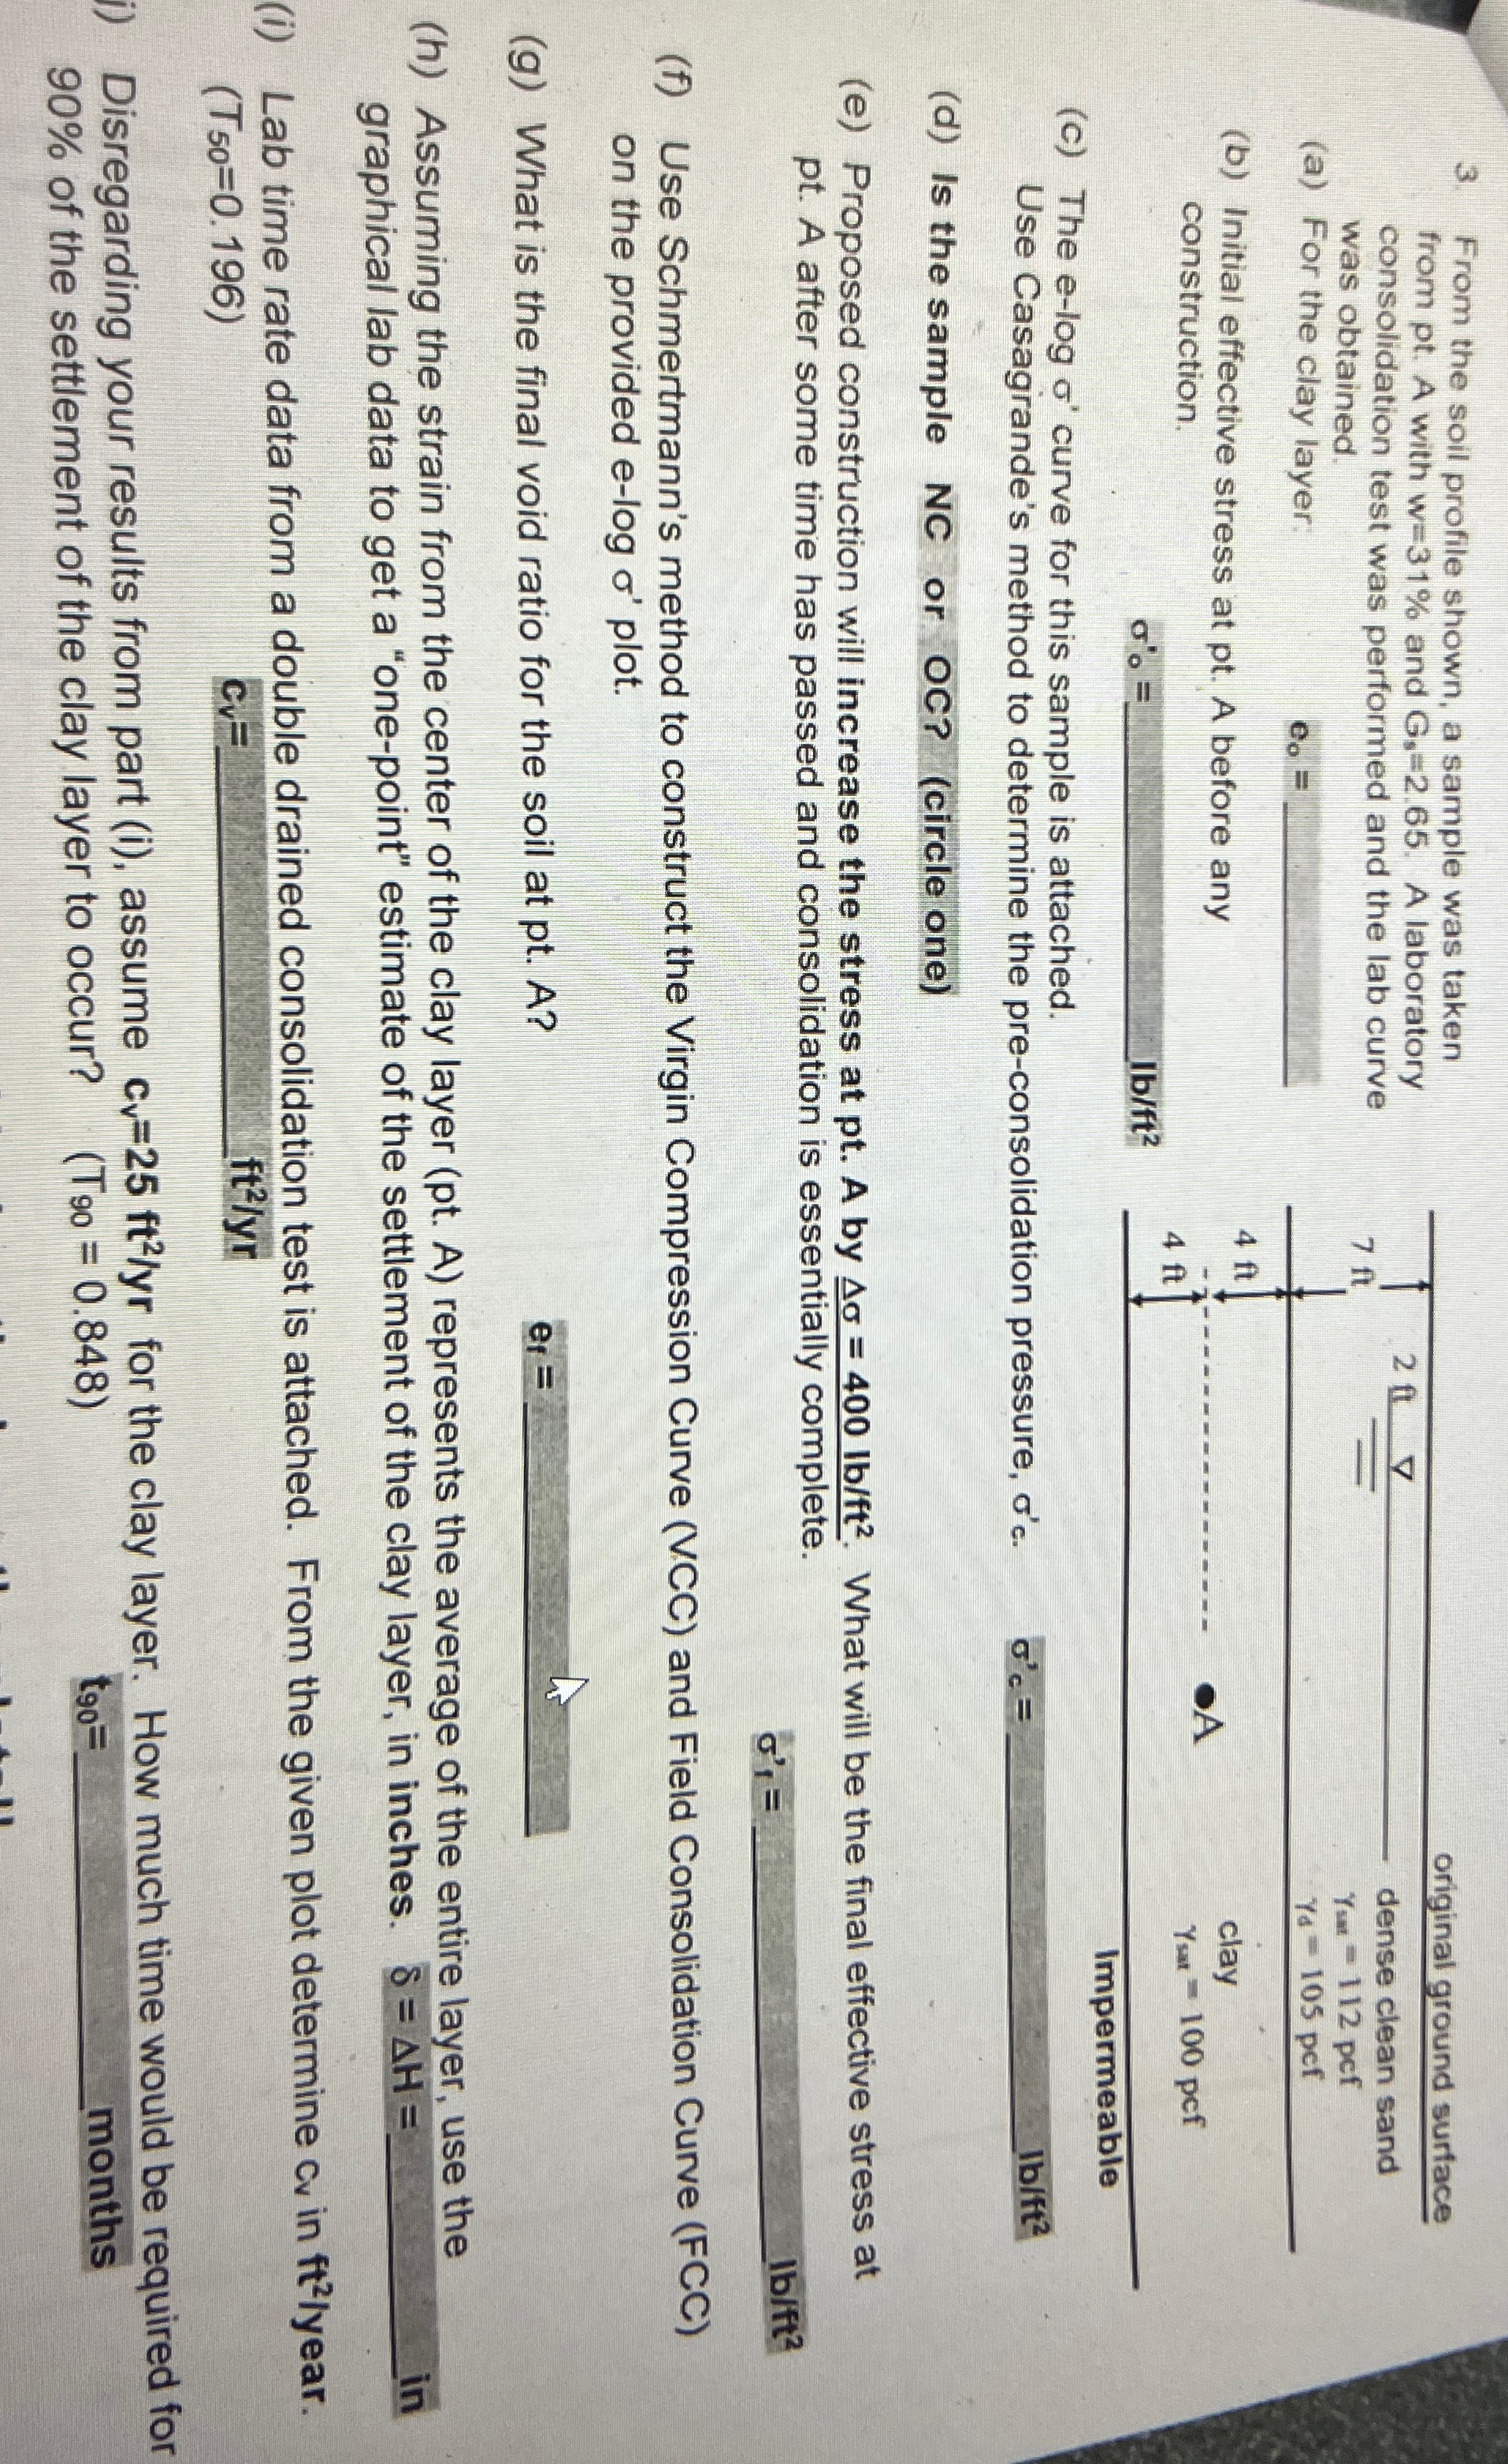
From the soil profile shown, a sample was taken from pt A with and A laboratory consolidation test was performed and the lab curve was obtained.
a For the clay layer:
b Initial effective stress at pt A before any construction.
c The elog curve for this sample is attached.
Use Casagrande's method to determine the preconsolidation pressure, c
d Is the sample NC or OCcircle onecircle one
e Proposed construction will increase the stress at pt A by What will be the final effective stress at pt A after some time has passed and consolidation is essentially complete.
f Use Schmertmann's method to construct the Virgin Compression Curve VCC and Field Consolidation Curve FCC on the provided elog plot.
g What is the final void ratio for the soil at pt A
h Assuming the strain from the center of the clay layer pt A represents the average of the entire layer, use the graphical lab data to get a "onepoint" estimate of the settlement of the clay layer, in inches. in
i Lab time rate data from a double drained consolidation test is attached. From the given plot determine in ear.
i Disregarding your results from part i assume for the clay layer. How much time would be required for of the settlement of the clay layer to occur?
months
Step by Step Solution
There are 3 Steps involved in it
1 Expert Approved Answer
Step: 1 Unlock

Question Has Been Solved by an Expert!
Get step-by-step solutions from verified subject matter experts
Step: 2 Unlock
Step: 3 Unlock