

Question: From the textbook in the Data analysis section (towards the end of the chapter) from Chapter 3. Do the following: Exercise 2 but replace September
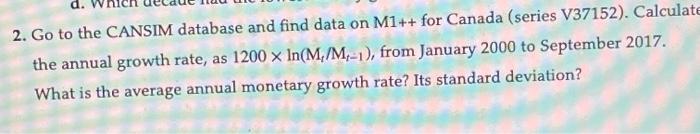
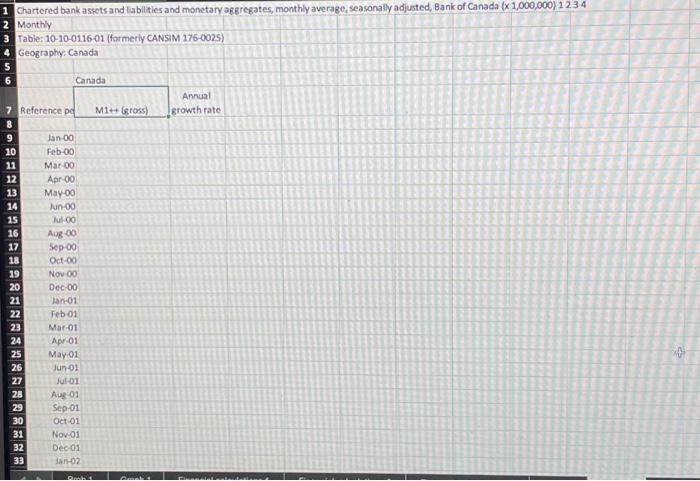
From the textbook in the Data analysis section (towards the end of the chapter) from Chapter 3. Do the following: Exercise 2 but replace September 2017 by the latest available data. Note how the formula for calculating the annual growth rate differs from the one in Problem 1 above, both compute annual growth rates but in a different way. See the MS Excel template for more details. Calculate the average growth rate and standard deviation as it is stated in the question in your Excel template on sheet Prob 5. d. 2. Go to the CANSIM database and find data on M1++ for Canada (series V37152). Calculate the annual growth rate, as 1200 x In(M/M-1), from January 2000 to September 2017. What is the average annual monetary growth rate? Its standard deviation? Chartered bank assets and liabilities and monetary aggregates, monthly average, seasonally adjusted, Bank of Canada (x1,000,000) 1 2 3 4 2 Monthly 3 Table: 10-10-0116 01 (formerly CANSIM 176-0025) 4 Geography: Canada 5 Canada Annual growth rate Reference pd Milgross) 9 10 11 12 13 14 15 16 17 18 19 20 21 22 23 24 25 26 27 28 29 30 31 32 33 Jan-00 Feb-00 Mar 00 Apr 00 May-00 Jun-00 Jul00 Aug-00 Sep-00 Oct-00 Nov 00 Dec 00 Jan-01 Feb 01 Mar-01 Apr 01 May 02 Jun 02 Jul-01 Aug 01 Sep-01 Oct 01 Nov.01 Dec 01 -02
Step by Step Solution
There are 3 Steps involved in it

Get step-by-step solutions from verified subject matter experts