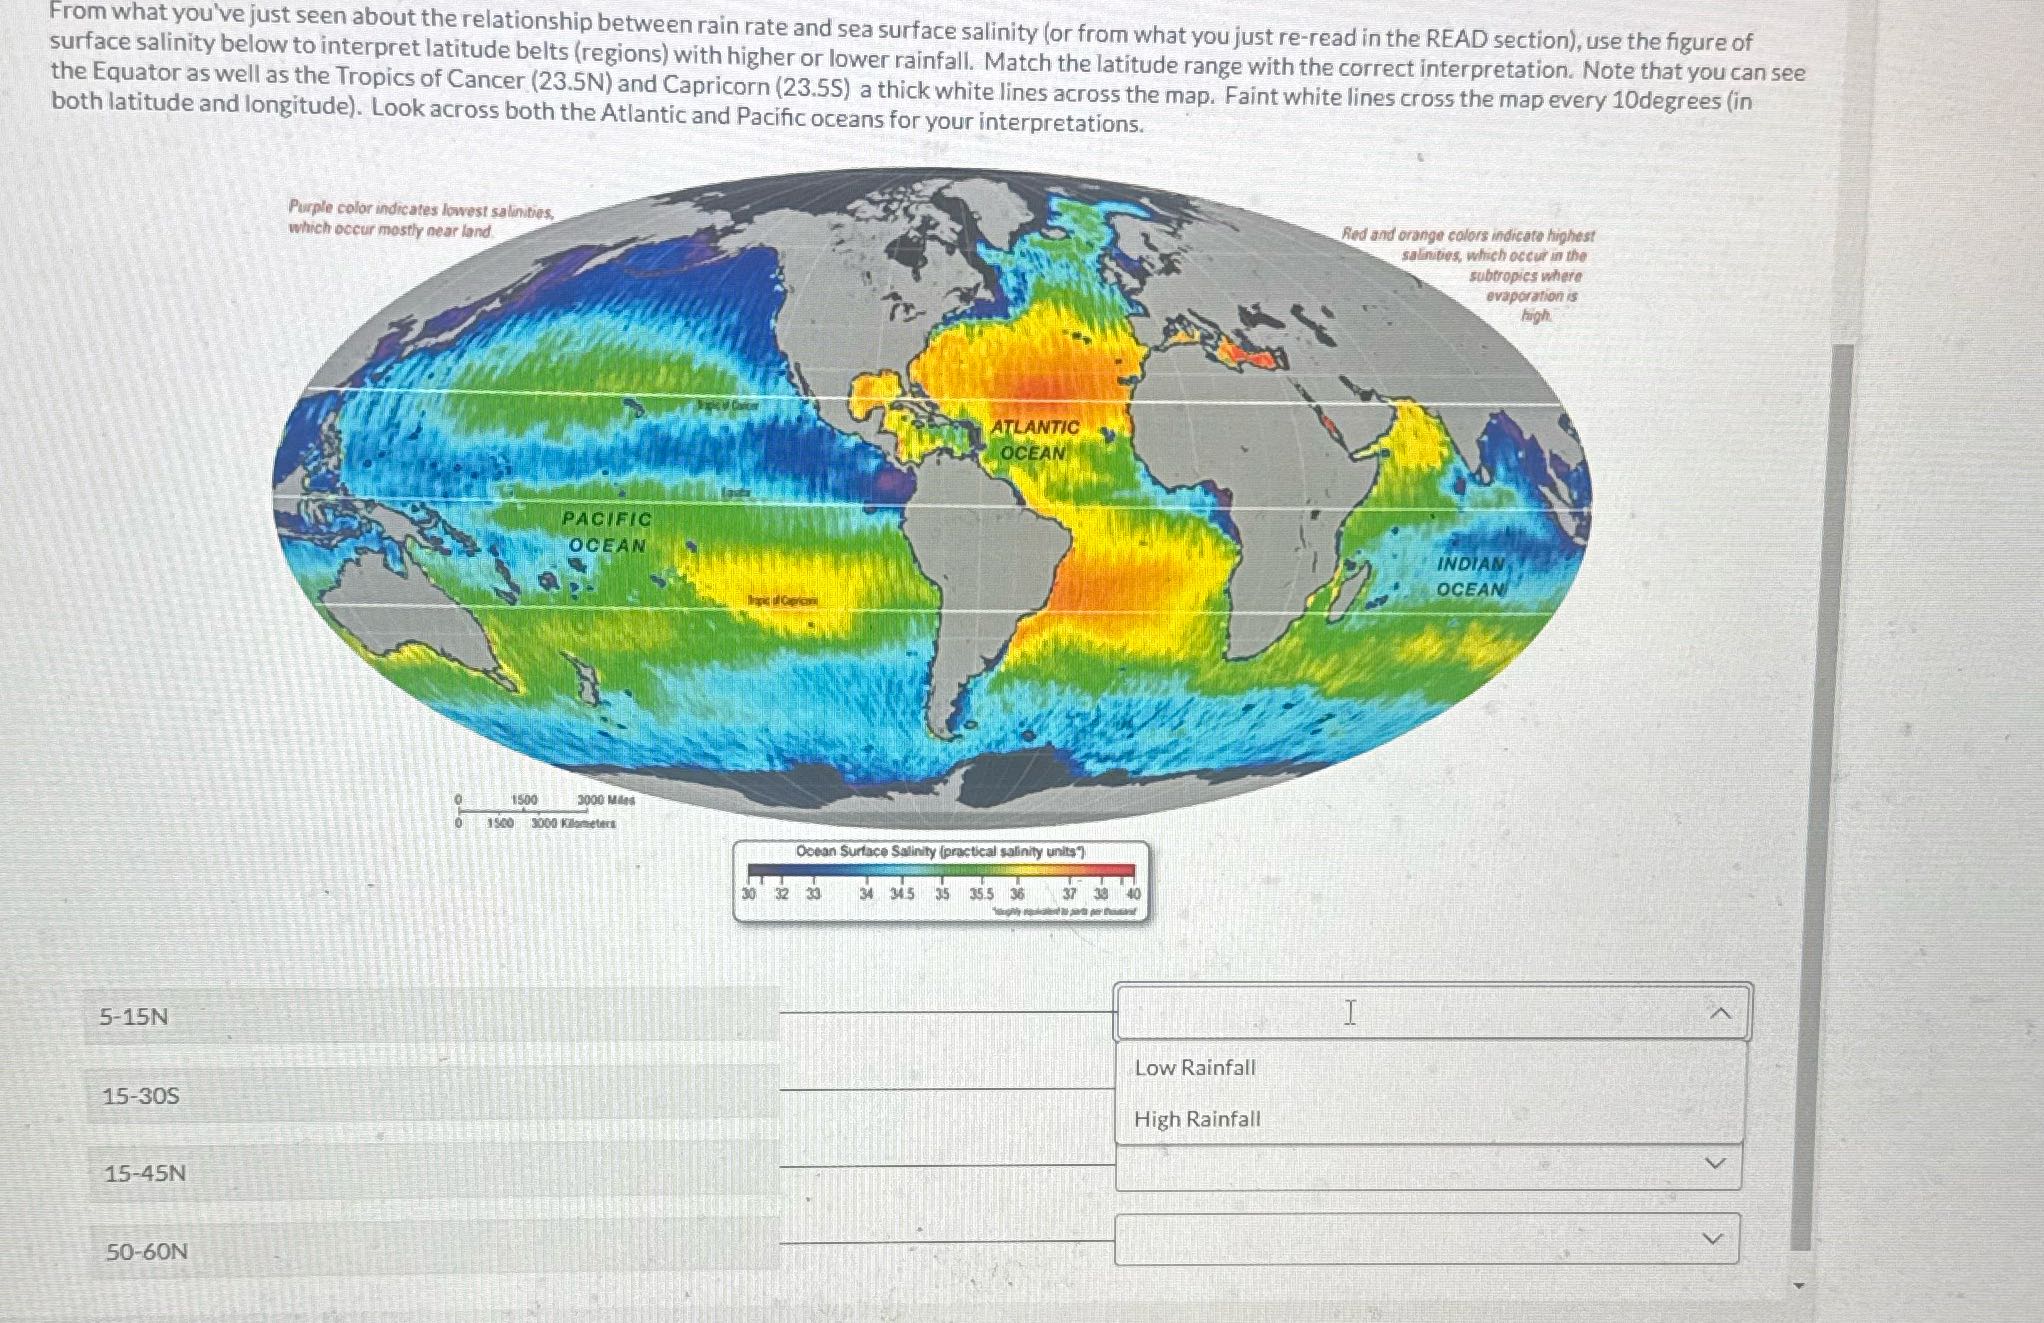
Question: ? From what you've just seen about the relationship between rain rate and sea surface salinity (or from what you just re-read in the READ

?

? From what you've just seen about the
From what you've just seen about the relationship between rain rate and sea surface salinity (or from what you just re-read in the READ section), use the figure of surface salinity below to interpret latitude belts (regions) with higher or lower rainfall. Match the latitude range with the correct interpretation. Note that you can see the Equator as well as the Tropics of Cancer (23.5N) and Capricorn (23.5S) a thick white lines across the map. Faint white lines cross the map every 10degrees (in both latitude and longitude). Look across both the Atlantic and Pacific oceans for your interpretations. Purple color indicates lowest salinities, which occur mostly near land. Red and orange colors indicate highest salinities, which occur in the subtropics where evaporation is ATLANTIC OCEAN PACIFIC OCEAN INDIAN OCEAN 1500 3000 Mass 0 1500 3000 Kilometers Ocean Surface Salinity (practical salinity units"] 10 32 33 34 345 35 35.5 36 37 38 40 5-15N Low Rainfall 15-30S High Rainfall 15-45N 50-60N

Step by Step Solution

There are 3 Steps involved in it

1 Expert Approved Answer
Step: 1 Unlock blur-text-image
Question Has Been Solved by an Expert!

Get step-by-step solutions from verified subject matter experts

Step: 2 Unlock
Step: 3 Unlock

Students Have Also Explored These Related Mathematics Questions!