

Question: . From your Unique Records only Filter in number 9, copy and paste the results starting in Cell A5 on the Data Table Sheet. Create
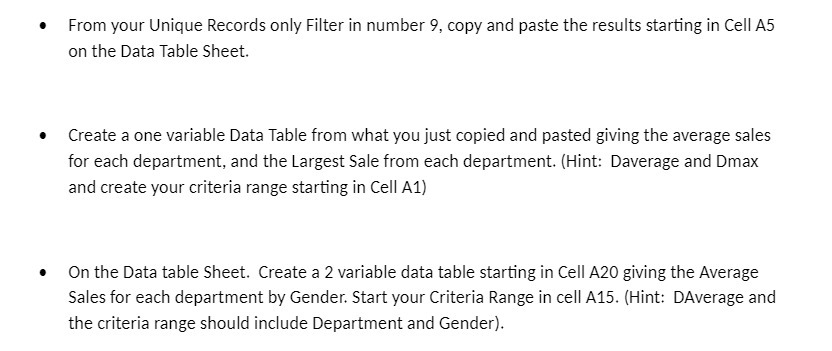
. From your Unique Records only Filter in number 9, copy and paste the results starting in Cell A5 on the Data Table Sheet. Create a one variable Data Table from what you just copied and pasted giving the average sales for each department, and the Largest Sale from each department. (Hint: Daverage and Dmax and create your criteria range starting in Cell A1) . On the Data table Sheet. Create a 2 variable data table starting in Cell A20 giving the Average Sales for each department by Gender. Start your Criteria Range in cell A15. (Hint: DAverage and the criteria range should include Department and Gender)
Step by Step Solution
There are 3 Steps involved in it
1 Expert Approved Answer
Step: 1 Unlock

Question Has Been Solved by an Expert!
Get step-by-step solutions from verified subject matter experts
Step: 2 Unlock
Step: 3 Unlock