

Question: full solutions with diagram Problem 4 The following table gives the result of inspection of 20 samples of 100 items each taken in 20 working
full solutions with diagram
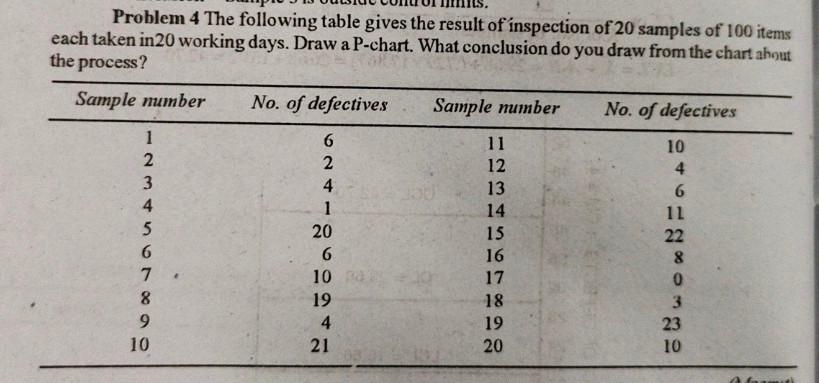
Problem 4 The following table gives the result of inspection of 20 samples of 100 items each taken in 20 working days. Draw a P-chart. What conclusion do you draw from the chart about the process? Sample mumber No. of defectives Sample number No. of defectives 1 2 3 4 6 2 4 1 20 6 11 12 13 14 15 16 17 10 4 6 11 22 8 0 5 6 7 8 9 10 10 19 4 21 18 19 3 23 20 10Step by Step Solution
There are 3 Steps involved in it
1 Expert Approved Answer
Step: 1 Unlock

Question Has Been Solved by an Expert!
Get step-by-step solutions from verified subject matter experts
Step: 2 Unlock
Step: 3 Unlock