

Question: Function plots We can plot a function us ng the command fplot ( f , limit ) as the following: fplot ( @cos , [
Function plots
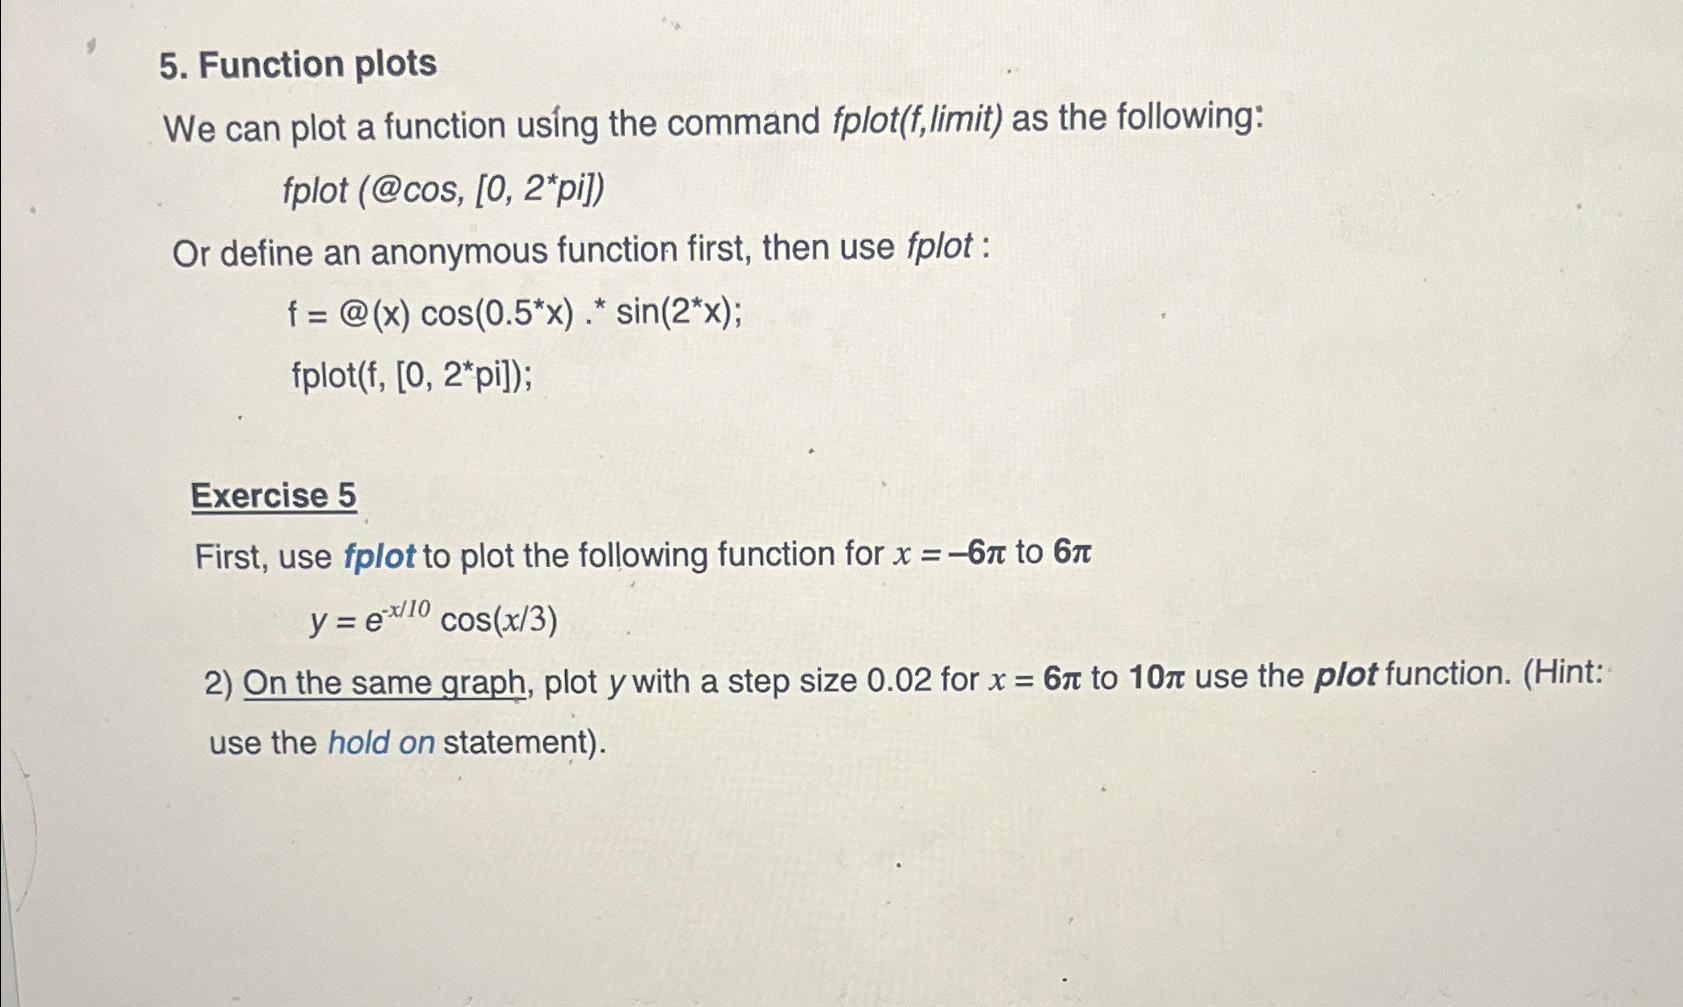
We can plot a function usng the command fplotflimit as the following:
fplot @cospi
Or define an anonymous function first, then use fplot :
Exercise
First, use fplot to plot the following function for to
On the same graph, plot with a step size for to use the plot function. Hint: use the hold on statement
Step by Step Solution
There are 3 Steps involved in it
1 Expert Approved Answer
Step: 1 Unlock

Question Has Been Solved by an Expert!
Get step-by-step solutions from verified subject matter experts
Step: 2 Unlock
Step: 3 Unlock