

Question: Functions and Bar Graph: Plot projectile trajectories using equations for ideal projectile motion in MATLAB: y(t)=y01/2g2+(v0sin(0))tx(t)=x0+(v0cos(0))t where y(t) is the vertical distance and x(t) is
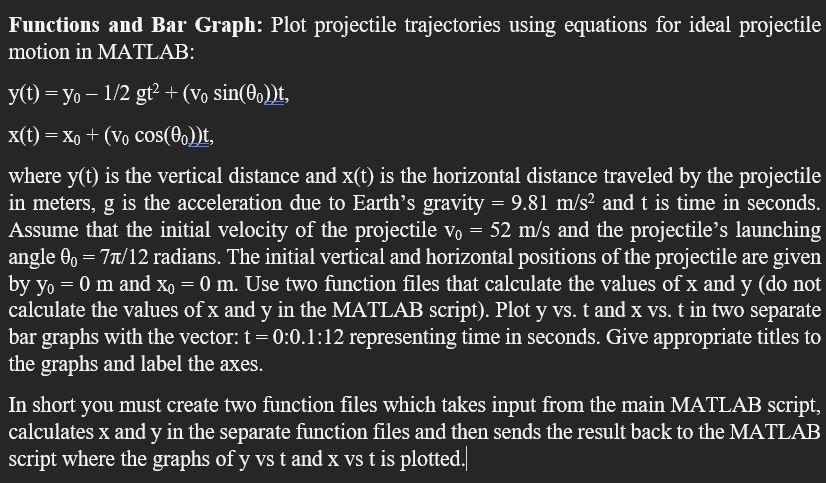
Functions and Bar Graph: Plot projectile trajectories using equations for ideal projectile motion in MATLAB: y(t)=y01/2g2+(v0sin(0))tx(t)=x0+(v0cos(0))t where y(t) is the vertical distance and x(t) is the horizontal distance traveled by the projectile in meters, g is the acceleration due to Earth's gravity =9.81m/s2 and t is time in seconds. Assume that the initial velocity of the projectile v0=52m/s and the projectile's launching angle 0=7/12 radians. The initial vertical and horizontal positions of the projectile are given by y0=0m and x0=0m. Use two function files that calculate the values of x and y (do not calculate the values of x and y in the MATLAB script). Plot yvs.t and x vs. t in two separate bar graphs with the vector: t=0:0.1:12 representing time in seconds. Give appropriate titles to the graphs and label the axes. In short you must create two function files which takes input from the main MATLAB script, calculates x and y in the separate function files and then sends the result back to the MATLAB script where the graphs of y vs t and x vs t is plotted
Step by Step Solution
There are 3 Steps involved in it

Get step-by-step solutions from verified subject matter experts