

Question: Please solve problem on matlab Let us plot projectile trajectories using equations for ideal projectile motion: 1 g(t) yo 3gt2 + (vo sin(66)), x(t) 20
Please solve problem on matlab
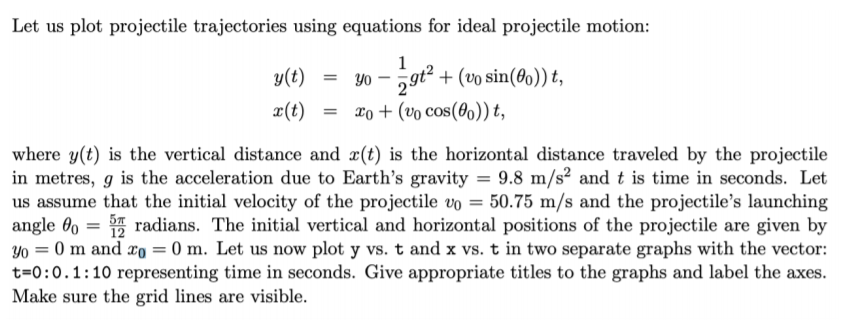
Let us plot projectile trajectories using equations for ideal projectile motion: 1 g(t) yo 3gt2 + (vo sin(66)), x(t) 20 + (vo cos(@o))t, where y(t) is the vertical distance and x(t) is the horizontal distance traveled by the projectile in metres, g is the acceleration due to Earth's gravity = 9.8 m/s2 and t is time in seconds. Let us assume that the initial velocity of the projectile vo = 50.75 m/s and the projectile's launching angle 0o = 12 radians. The initial vertical and horizontal positions of the projectile are given by yo = 0 m and xo = 0 m. Let us now plot y vs. t and x vs. t in two separate graphs with the vector: t=0:0.1:10 representing time in seconds. Give appropriate titles to the graphs and label the axes. Make sure the grid lines are visible
Step by Step Solution
There are 3 Steps involved in it

Get step-by-step solutions from verified subject matter experts