

Question: G. CEO Performance (Refer to Problem 31 in Section 4.1) The following data represent the total compensation for 12 randon ly selected chief executive officers
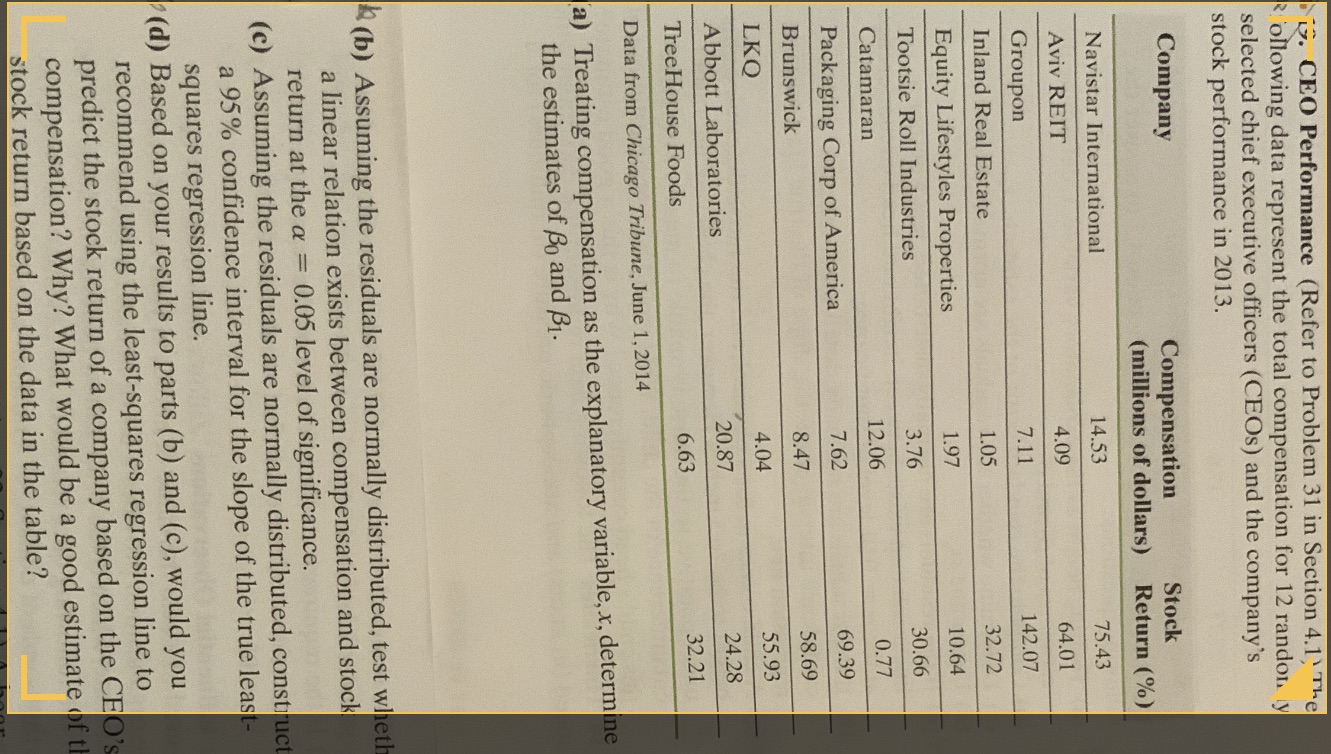
G. CEO Performance (Refer to Problem 31 in Section 4.1) The following data represent the total compensation for 12 randon ly selected chief executive officers (CEOs) and the company's stock performance in 2013. Company Compensation Stock (millions of dollars) Return (%) Navistar International 14.53 75.43 Aviv REIT 4.09 64.01 Groupon 7.11 142.07 Inland Real Estate 1.05 32.72 Equity Lifestyles Properties 1.97 10.64 Tootsie Roll Industries 3.76 30.66 Catamaran 12.06 0.77 Packaging Corp of America 7.62 69.39 Brunswick 8.47 58.69 LKQ 4.04 55.93 Abbott Laboratories 20.87 24.28 Tree House Foods 6.63 32.21 Data from Chicago Tribune, June 1, 2014 a) Treating compensation as the explanatory variable, x, determine the estimates of Bo and B1. (b) Assuming the residuals are normally distributed, test wheth a linear relation exists between compensation and stock return at the a = 0.05 level of significance. (c) Assuming the residuals are normally distributed, construct a 95% confidence interval for the slope of the true least- squares regression line. (d) Based on your results to parts (b) and (c), would you recommend using the least-squares regression line to predict the stock return of a company based on the CEO' compensation? Why? What would be a good estimate of t stock return based on the data in the table
Step by Step Solution
There are 3 Steps involved in it

Get step-by-step solutions from verified subject matter experts