

Question: g. How does the level Of 6. Ten data points on Y and X are employed to estimate the parameters in the lin. ear relation
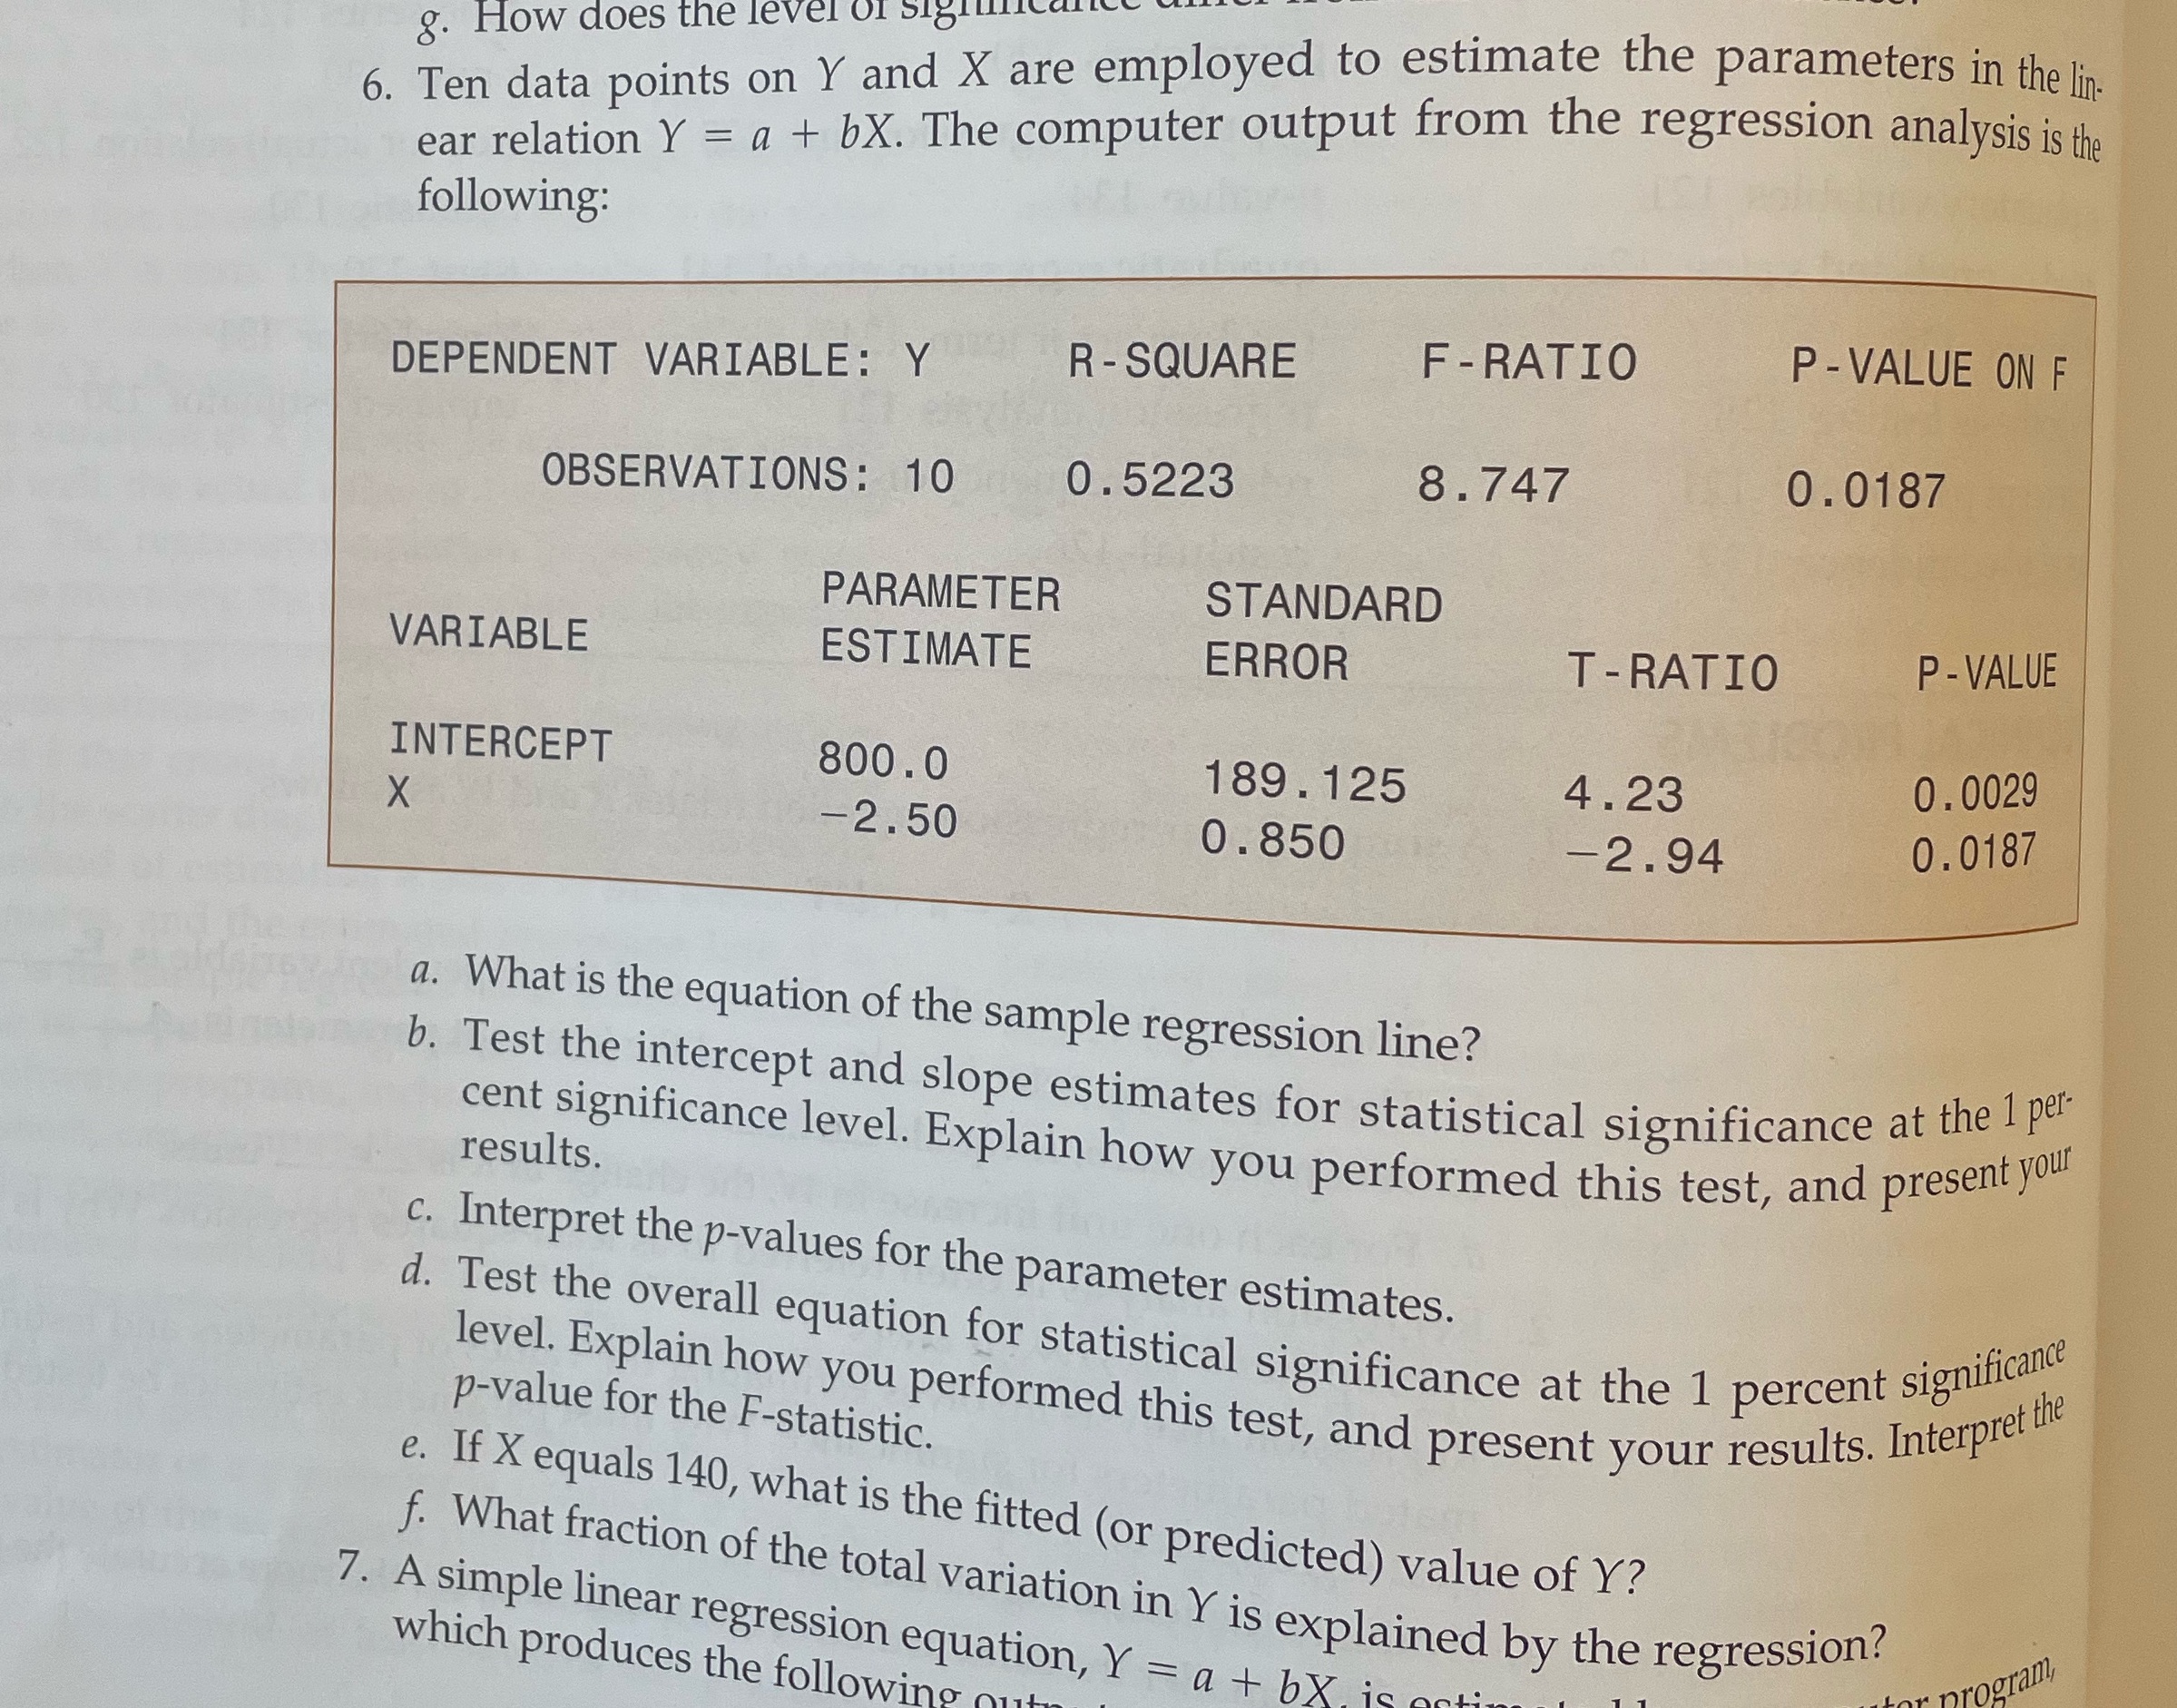
g. How does the level Of 6. Ten data points on Y and X are employed to estimate the parameters in the lin. ear relation Y = a + bX. The computer output from the regression analysis is the following: DEPENDENT VARIABLE : Y R - SQUARE F - RATIO P - VALUE ON F OBSERVATIONS : 10 0 . 5223 8. 747 0 . 0187 PARAMETER STANDARD VARIABLE ESTIMATE ERROR T - RATIO P - VALUE INTERCEPT 800.0 189. 125 4. 23 0. 0029 X -2.50 0 . 850 -2.94 0. 0187 a. What is the equation of the sample regression line? b. Test the intercept and slope estimates for statistical significance at the 1 per results. cent significance level. Explain how you performed this test, and present your c. Interpret the p-values for the parameter estimates. d. Test the overall equation for statistical significance at the 1 percent significance level. Explain how you performed this test, and present your results. Interpret the p-value for the F-statistic. e. If X equals 140, what is the fitted (or predicted) value of Y? f. What fraction of the total variation in Y is explained by the regression! 7. A simple linear regression equation, Y = a + bX is which produces the following program
Step by Step Solution
There are 3 Steps involved in it

Get step-by-step solutions from verified subject matter experts