

Question: G Show all work in this worksheet (with all calculation done using Excel - no manual calculations), then answer the questions in the Answers worksheet.
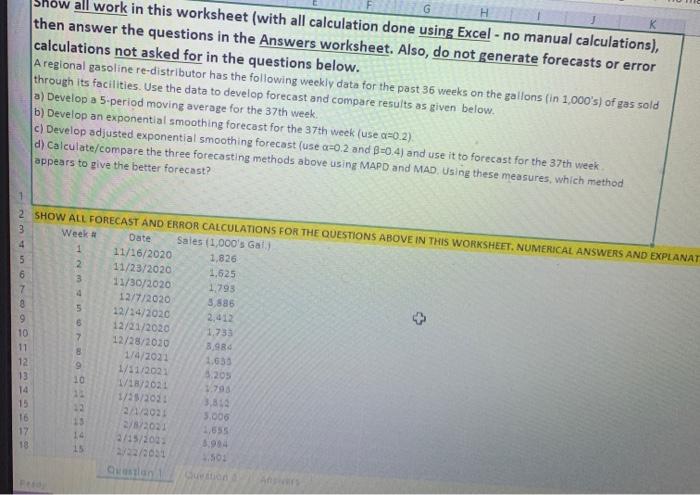
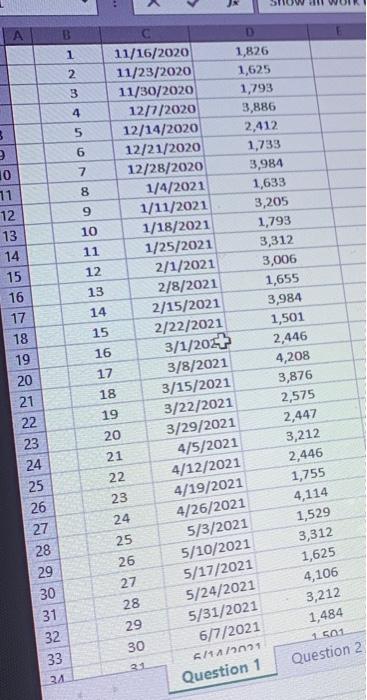
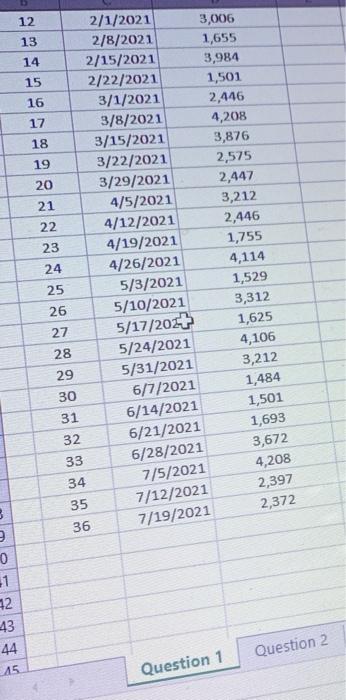
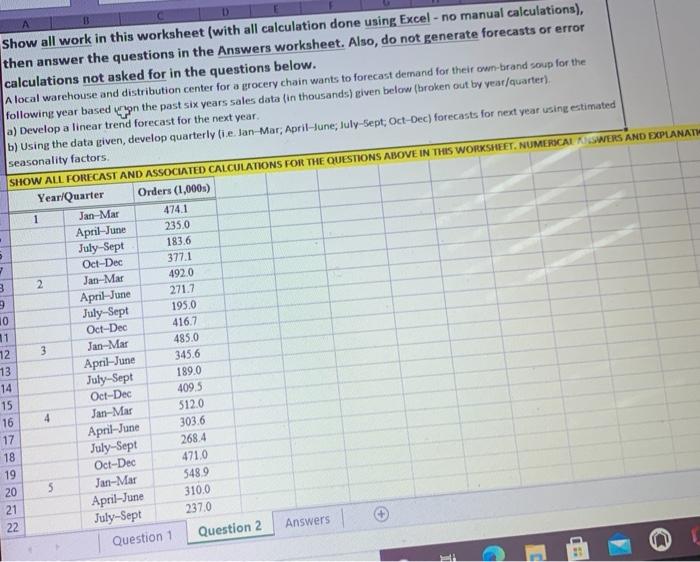
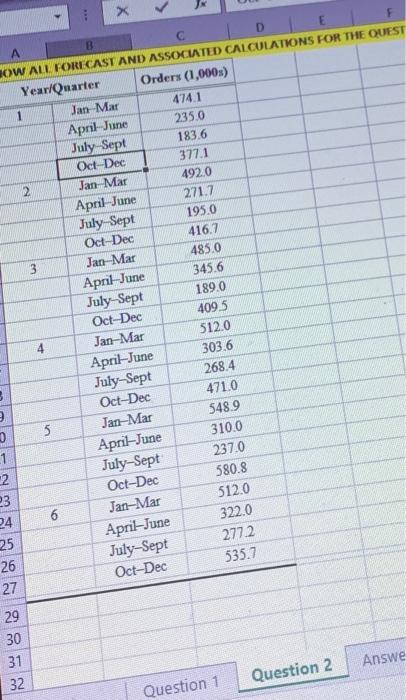
G Show all work in this worksheet (with all calculation done using Excel - no manual calculations), then answer the questions in the Answers worksheet. Also, do not generate forecasts or error calculations not asked for in the questions below. A regional gasoline re-distributor has the following weekly data for the past 36 weeks on the gallons (in 1.000's) of gas sold through its facilities. Use the data to develop forecast and compare results as given below. a) Develop a 5-period moving average for the 37th week. b) Develop an exponential smoothing forecast for the 37th week (use a=0.2). c) Develop adjusted exponential smoothing forecast (use =0.2 and B=0 4) and use it to forecast for the 37th week d) Calculate/compare the three forecasting methods above using MAPD and MAD. Using these measures, which method appears to give the better forecast? -NOS 2 SHOW ALL FORECAST AND ERROR CALCULATIONS FOR THE QUESTIONS ABOVE IN THIS WORKSHEET. NUMERICAL ANSWERS AND EXPLANAT 3 Week Date Sales (1,000's Gal 4 1 11/16/2020 1,826 2 11/23/2020 1.525 3 11/30/2020 1.793 4 12/7/2020 3,886 5 12/14/2020 2,412 6 12/21/2020 1.733 10 7 12/28/2010 3.984 11 1/4/2021 1.633 12 9 1/31/2021 5.205 13 10 1/18/2021 1.79 14 1/25/203 15 12 212021 16 13 2/2021 17 157203 18 15 27223031 30 ustan B 1 2 3 4 8 5 6 1,826 1,625 1,793 3,886 2,412 1,733 3,984 1,633 3,205 1,793 3,312 3,006 7 11/16/2020 11/23/2020 11/30/2020 12/7/2020 12/14/2020 12/21/2020 12/28/2020 1/4/2021 1/11/2021 1/18/2021 1/25/2021 2/1/2021 2/8/2021 2/15/2021 2/22/2021 8 9 10 11 12 13 14 15 16 17 18 19 10 71 12 13 14 15 16 17 18 19 20 21 22 23 24 25 26 27 28 29 30 31 32 33 24 1,655 3,984 1,501 2.446 4,208 3,876 2,575 2,447 3,212 2,446 20 21 22 23 24 25 26 27 28 29 30 3/1/2017 3/8/2021 3/15/2021 3/22/2021 3/29/2021 4/5/2021 4/12/2021 4/19/2021 4/26/2021 5/3/2021 5/10/2021 5/17/2021 5/24/2021 5/31/2021 6/7/2021 s/4 /2n1 Question 1 1,755 4,114 1,529 3,312 1,625 4,106 3,212 1,484 12501 Question 2 31 12 13 14 15 16 17 18 19 2/1/2021 2/8/2021 2/15/2021 2/22/2021 3/1/2021 3/8/2021 3/15/2021 3/22/2021 3/29/2021 4/5/2021 4/12/2021 4/19/2021 4/26/2021 5/3/2021 5/10/2021 20 21 3,006 1,655 3,984 1,501 2,446 4,208 3,876 2,575 2,447 3,212 2,446 1,755 4,114 1,529 3,312 1,625 4,106 3,212 1,484 22 23 24 25 26 27 28 29 30 31 32 33 34 5/17/202+ 5/24/2021 5/31/2021 6/7/2021 6/14/2021 6/21/2021 6/28/2021 7/5/2021 7/12/2021 7/19/2021 1,501 1,693 3,672 4,208 2,397 2,372 35 8 36 0 1 22 43 44 15 Question 2 Question 1 B Show all work in this worksheet (with all calculation done using Excel - no manual calculations), then answer the questions in the Answers worksheet. Also, do not generate forecasts or error calculations not asked for in the questions below. A local warehouse and distribution center for a grocery chain wants to forecast demand for their own-brand soup for the following year based on the past six years sales data (in thousands) given below (broken out by year/quarter), a) Develop a linear trend forecast for the next year. b) Using the data given, develop quarterly die, Jan-Mar, April-lune; July-Sept: Oct-Dec) forecasts for next year using estimated seasonality factors SHOW ALL FORECAST AND ASSOCIATED CALCULATIONS FOR THE QUESTIONS ABOVE IN THIS WORKSHEET. NUMERICAL KISWERS AND EXPLANAT Year/Quarter Orders (1,000) 1 Jan-Mar 474.1 April-June 235.0 July-Sept 183.6 7 Oct-Dec 377.1 3 2 Jan-Mar 492.0 9 April-June 2717 10 July-Sept 195.0 11 Oct-Dec 416.7 12 3 Jan-Mar 485.0 13 April-June 345.6 14 July-Sept 189.0 15 Oct-Dec 4095 16 4 Jan-Mar 512.0 17 April-June 303.6 18 July-Sept 268.4 4710 Oct-Dec 19 20 5 Jan-Mar 310.0 April-June 21 237,0 July-Sept 22 Answers Question 2 Question 1 5489 X B DIE BOW ALL FORECAST AND ASSOCIATED CALCULATIONS FOR THE QUEST Year/Quarter Orders (1,000) 1 Jan Mar 474.1 April-June 235.0 July Sept 183.6 Oct-Dec 377.1 2 Jan Mar 492.0 April-June 271.7 July-Sept 195.0 Oct Dec 416.7 Jan-Mar 485.0 April-June 345.6 July-Sept 189.0 Oct-Dec 4095 4 Jan-Mar 512.0 April-June 303.6 July-Sept 268.4 Oct-Dec 471.0 5 Jan-Mar 5489 April-June 310.0 July-Sept 237.0 Oct-Dec 580.8 6 Jan-Mar 512.0 April-June 322.0 July-Sept 277.2 Oct-Dec 535.7 3 D 1 -2 23 24 25 26 27 29 30 31 32 Answe Question 2 Question 1
Step by Step Solution
There are 3 Steps involved in it

Get step-by-step solutions from verified subject matter experts