

Question: g the histograms below, answer part a and b. Class 1 Class 2 Frequency Frequency N 75 55 Just Scores Test Scores a. Which class
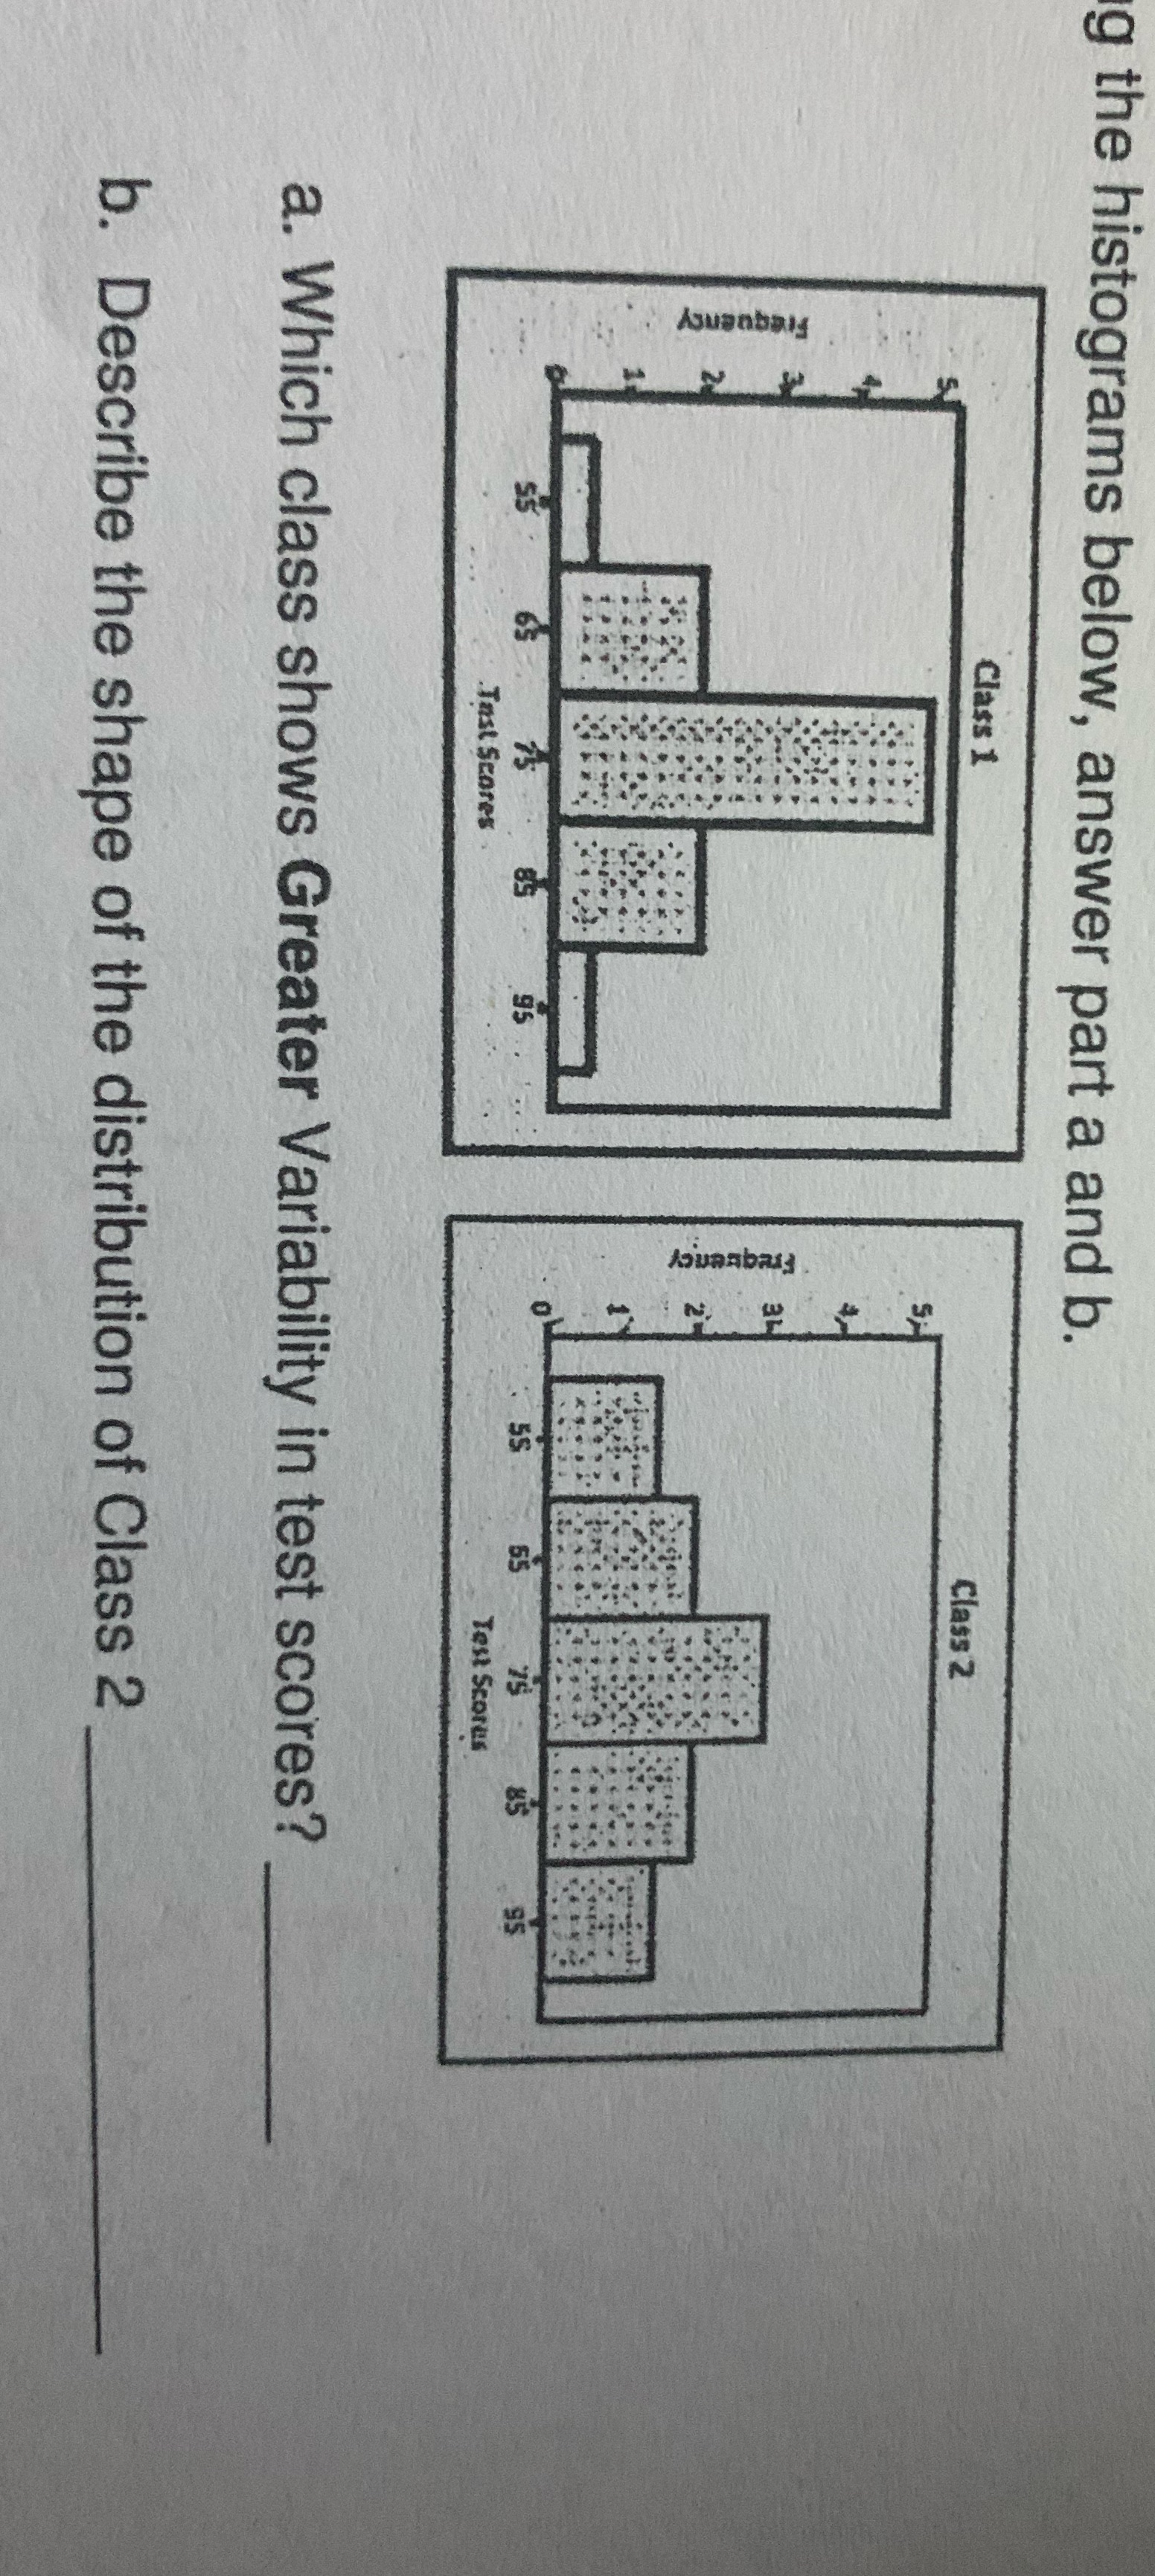
g the histograms below, answer part a and b. Class 1 Class 2 Frequency Frequency N 75 55 Just Scores Test Scores a. Which class shows Greater Variability in test scores? b. Describe the shape of the distribution of Class 2
Step by Step Solution
There are 3 Steps involved in it
1 Expert Approved Answer
Step: 1 Unlock

Question Has Been Solved by an Expert!
Get step-by-step solutions from verified subject matter experts
Step: 2 Unlock
Step: 3 Unlock