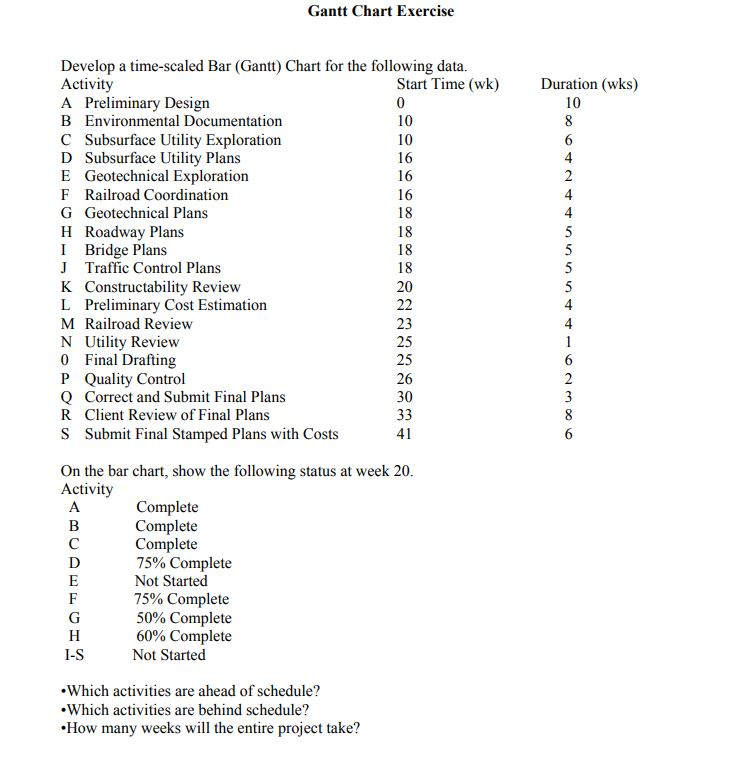
Question: Gantt Chart Exercise Develop a time-scaled Bar (Gantt Chart for the following data. Activity Start Time (wk) A Preliminary Design 0 B Environmental Documentation 10

Gantt Chart Exercise Develop a time-scaled Bar

Gantt Chart Exercise Develop a time-scaled Bar (Gantt Chart for the following data. Activity Start Time (wk) A Preliminary Design 0 B Environmental Documentation 10 C Subsurface Utility Exploration 10 D Subsurface Utility Plans 16 E Geotechnical Exploration 16 F Railroad Coordination 16 G Geotechnical Plans 18 H Roadway Plans 18 I Bridge Plans 18 J Traffic Control Plans 18 K Constructability Review L Preliminary Cost Estimation 22 M Railroad Review 23 N Utility Review 25 0 Final Drafting 25 P Quality Control 26 Q Correct and Submit Final Plans 30 R Client Review of Final Plans 33 S Submit Final Stamped Plans with Costs 41 Duration (wks) 10 8 6 4 2 4 4 5 5 5 5 4 4 20 6 2 3 8 6 On the bar chart, show the following status at week 20. Activity A Complete B Complete Complete D 75% Complete E Not Started F 75% Complete G 50% Complete H 60% Complete I-S Not Started Which activities are ahead of schedule? Which activities are behind schedule? How many weeks will the entire project take

Step by Step Solution

There are 3 Steps involved in it

1 Expert Approved Answer
Step: 1 Unlock blur-text-image
Question Has Been Solved by an Expert!

Get step-by-step solutions from verified subject matter experts

Step: 2 Unlock
Step: 3 Unlock

Students Have Also Explored These Related General Management Questions!