

Question: gaussian fitting for Matlab/ I am trying gaussian fitting using matlab. You want to obtain the parameters and plot the fitted gaussian function calculated over
gaussian fitting for Matlab/
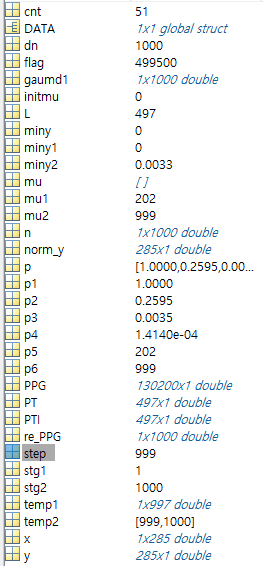
I am trying gaussian fitting using matlab. You want to obtain the parameters and plot the fitted gaussian function calculated over the original signal. However, in this process, one of the parameters, mu2, is fixed to 999. How do I fix the code?
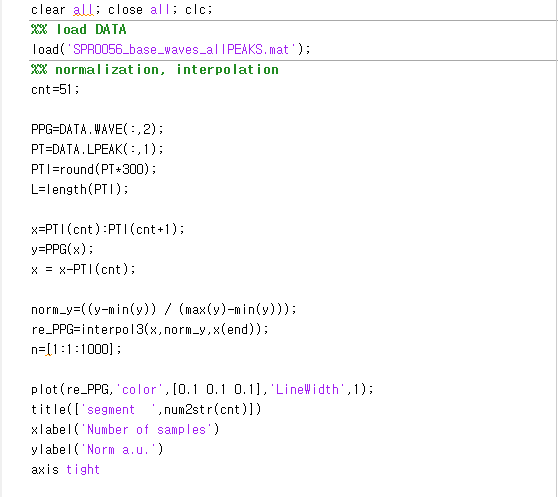
clear all; close all; clc; %% load DATA load('SPR0056_base_waves_allPEAKS.mat'); %% normalization, interpolation cnt=51;
PPG=DATA.WAVE(:,2); PT=DATA.LPEAK(:,1); PTI=round(PT*300); L=length(PTI);
x=PTI(cnt):PTI(cnt+1); y=PPG(x); x = x-PTI(cnt);
norm_y=((y-min(y)) / (max(y)-min(y))); re_PPG=interpol3(x,norm_y,x(end)); n=[1:1:1000];
plot(re_PPG,'color',[0.1 0.1 0.1],'LineWidth',1); title(['segment ',num2str(cnt)]) xlabel('Number of samples') ylabel('Norm a.u.') axis tight
%p= segGaussFit(n, re_PPG, 2, 1)
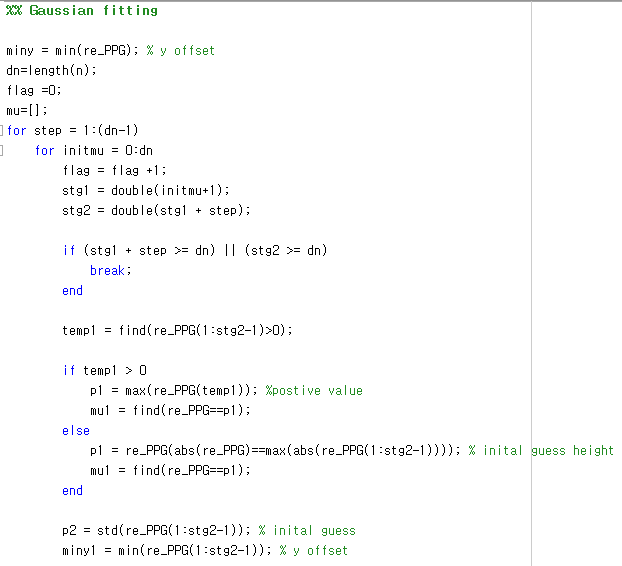
%% Gaussian fitting
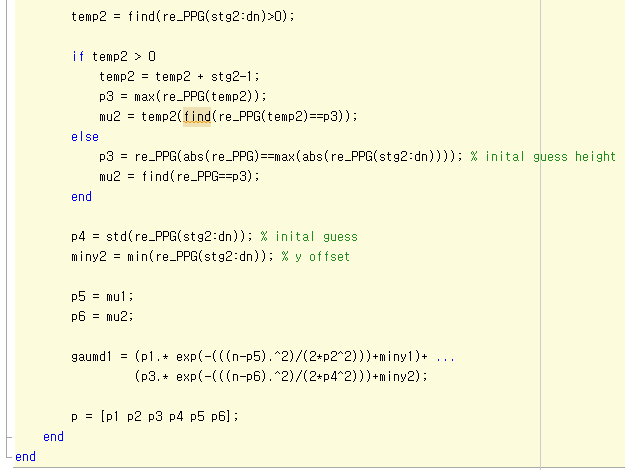
miny = min(re_PPG); % y offset dn=length(n); flag =0; mu=[]; for step = 1:(dn-1) for initmu = 0:dn flag = flag +1; stg1 = double(initmu+1); stg2 = double(stg1 + step); if (stg1 + step >= dn) || (stg2 >= dn) break; end temp1 = find(re_PPG(1:stg2-1)>0); if temp1 > 0 p1 = max(re_PPG(temp1)); %postive value mu1 = find(re_PPG==p1); else p1 = re_PPG(abs(re_PPG)==max(abs(re_PPG(1:stg2-1)))); % inital guess height mu1 = find(re_PPG==p1); end p2 = std(re_PPG(1:stg2-1)); % inital guess miny1 = min(re_PPG(1:stg2-1)); % y offset temp2 = find(re_PPG(stg2:dn)>0); if temp2 > 0 temp2 = temp2 + stg2-1; p3 = max(re_PPG(temp2)); mu2 = temp2(find(re_PPG(temp2)==p3)); else p3 = re_PPG(abs(re_PPG)==max(abs(re_PPG(stg2:dn)))); % inital guess height mu2 = find(re_PPG==p3); end p4 = std(re_PPG(stg2:dn)); % inital guess miny2 = min(re_PPG(stg2:dn)); % y offset p5 = mu1; p6 = mu2;
gaumd1 = (p1.* exp(-(((n-p5).^2)/(2*p2^2)))+miny1)+ ... (p3.* exp(-(((n-p6).^2)/(2*p4^2)))+miny2);
p = [p1 p2 p3 p4 p5 p6]; end end
clear al close al l clc; load DATA load( SPR0056 base-waves_al IPEAKS.mat) normal i zation, interpolation cnt 51 PPG-DATA. WAVE(,2) PT-DATA. LPEAK( : , 1 ) ; PT I round (PT+300); L-length(PTI) -PTI (cnt) :PTI (cnt +1 ) ; y-PPG(x) x = x-PTI (cnt ) ; norm_y ((y-min(y)) / (max(y)-min(y))); re-PPG-interpol 3(x, norm-y, x( end)) ; n [11:1000] plot (re_PPG, color,[0.1 0.1 0.11, LineWidth,1); title(I segment num2str(cnt)]) xlabel Number of samples') ylabel Norm a.u.') axis tight clear al close al l clc; load DATA load( SPR0056 base-waves_al IPEAKS.mat) normal i zation, interpolation cnt 51 PPG-DATA. WAVE(,2) PT-DATA. LPEAK( : , 1 ) ; PT I round (PT+300); L-length(PTI) -PTI (cnt) :PTI (cnt +1 ) ; y-PPG(x) x = x-PTI (cnt ) ; norm_y ((y-min(y)) / (max(y)-min(y))); re-PPG-interpol 3(x, norm-y, x( end)) ; n [11:1000] plot (re_PPG, color,[0.1 0.1 0.11, LineWidth,1); title(I segment num2str(cnt)]) xlabel Number of samples') ylabel Norm a.u.') axis tight
Step by Step Solution
There are 3 Steps involved in it

Get step-by-step solutions from verified subject matter experts