

Question: General Instructions: Put all your solutions on the OneNote page. You may write all your solutions and answers on a piece of paper and attach
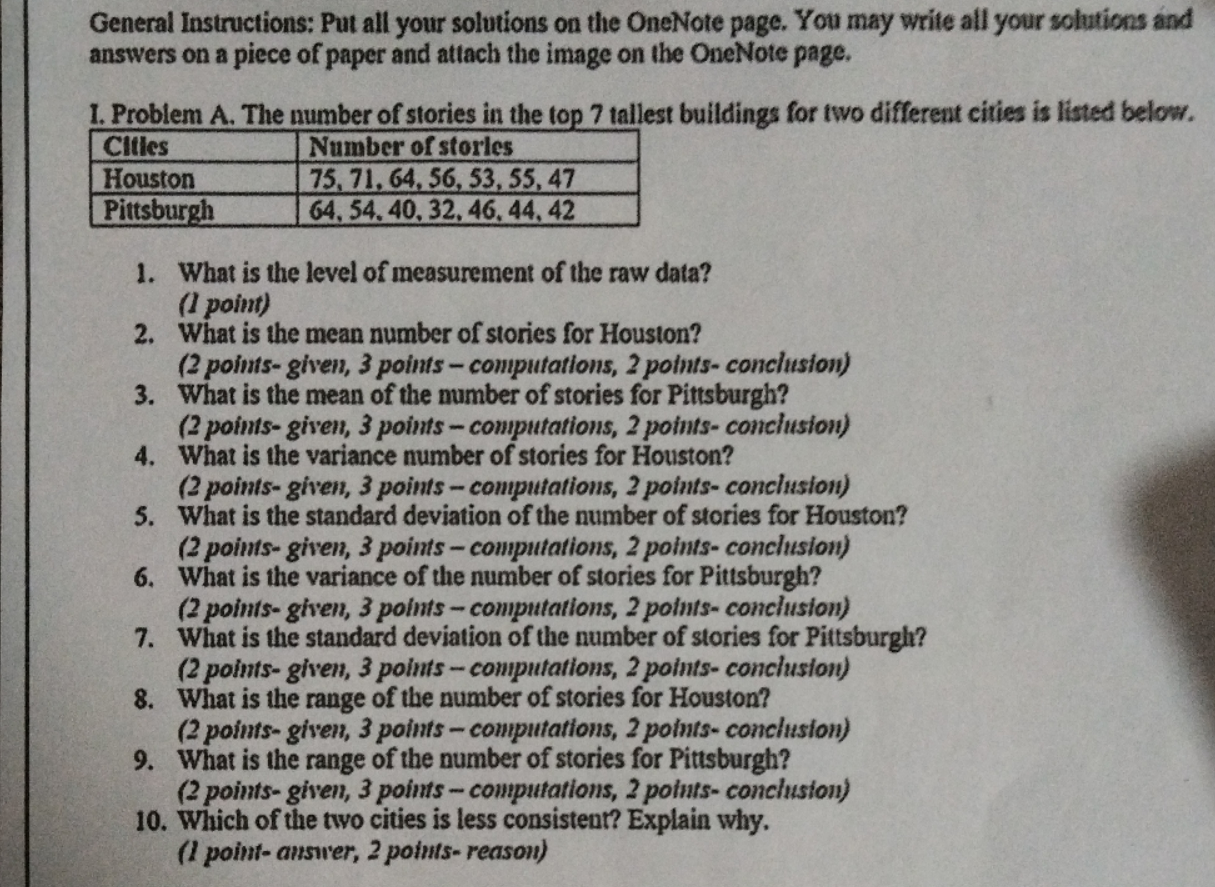
General Instructions: Put all your solutions on the OneNote page. You may write all your solutions and answers on a piece of paper and attach the image on the OneNote page. I. Problem A. The number of stories in the top 7 tallest buildings for two different cities is listed below. Cities Number of stories Houston 75, 71, 64, 56, 53, 55, 47 Pittsburgh 64, 54. 40, 32. 46. 44, 42 1. What is the level of measurement of the raw data? (1 point) 2. What is the mean number of stories for Houston? (2 points- given, 3 points - computations, 2 points- conclusion) 3. What is the mean of the number of stories for Pittsburgh? (2 points- given, 3 points - computations, 2 points- conclusion) 4. What is the variance number of stories for Houston? (2 points- given, 3 points - computations, 2 points- conclusion) 5. What is the standard deviation of the number of stories for Houston? (2 points- given, 3 points - computations, 2 points- conclusion) 6. What is the variance of the number of stories for Pittsburgh? (2 points- given, 3 points - computations, 2 points- conclusion) 7. What is the standard deviation of the number of stories for Pittsburgh? (2 points- given, 3 points - computations, 2 points- conclusion) 8. What is the range of the number of stories for Houston? (2 points- given, 3 points - computations, 2 points- conclusion) 9. What is the range of the number of stories for Pittsburgh? (2 points- given, 3 points - computations, 2 points- conclusion) 10. Which of the two cities is less consistent? Explain why. (1 point- answer, 2 points- reason)
Step by Step Solution
There are 3 Steps involved in it

Get step-by-step solutions from verified subject matter experts