

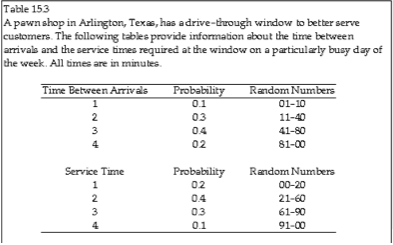
Question: Generate a simulation analysis from the data from Table 15-3. (Screenshot) According to Table 15-3, the time between successive arrivals is 1, 2, 3, or
- Generate a simulation analysis from the data from Table 15-3. (Screenshot)
- According to Table 15-3, the time between successive arrivals is 1, 2, 3, or 4 minutes. If the store opens at 8:00 AM and random numbers are used to generate arrivals, what time would the first customer arrive if the first random number were 02?
Step by Step Solution
There are 3 Steps involved in it
1 Expert Approved Answer
Step: 1 Unlock

Question Has Been Solved by an Expert!
Get step-by-step solutions from verified subject matter experts
Step: 2 Unlock
Step: 3 Unlock