

Question: Geometry w/Data X S Geometry w/Data X Geometry w/Data X S 12.03 Measure of X Schoology X S Schoology X Course Hero X Microsoft Word

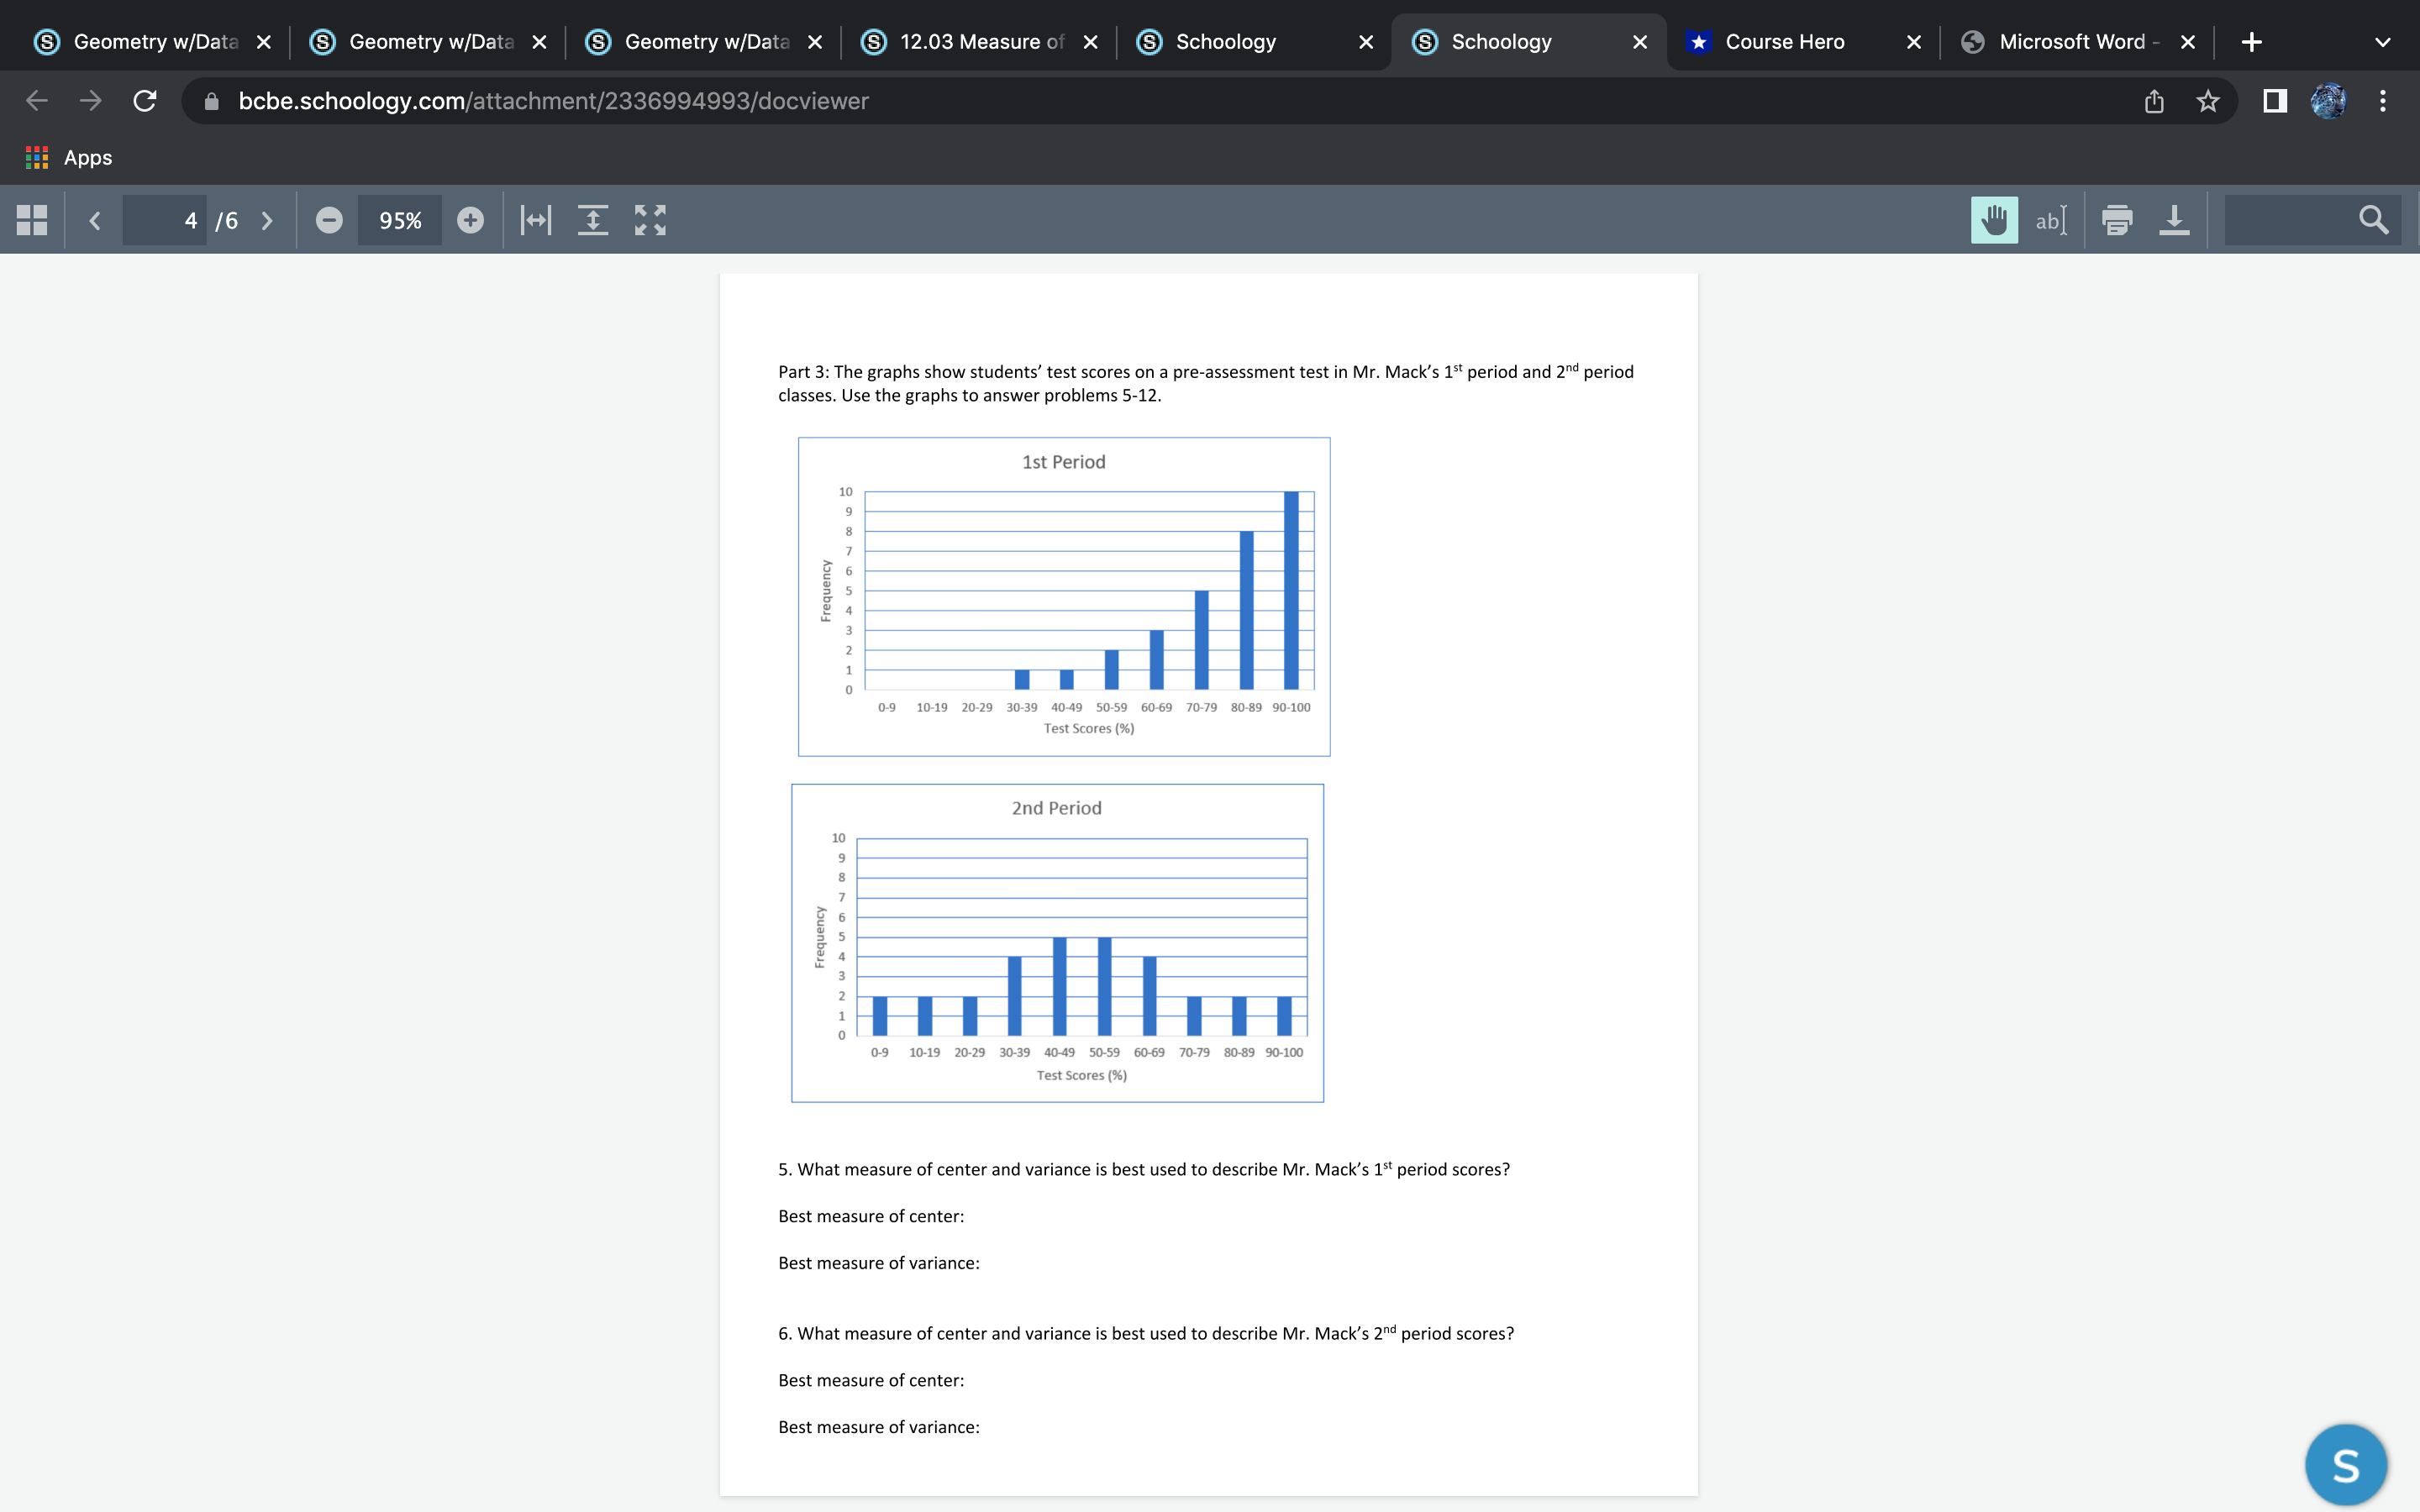

Geometry w/Data X S Geometry w/Data X Geometry w/Data X S 12.03 Measure of X Schoology X S Schoology X Course Hero X Microsoft Word - X C bcbe.schoology.com/attachment/2336994993/docviewer . . . Apps 4 /6 > 95% ab Part 3: The graphs show students' test scores on a pre-assessment test in Mr. Mack's 1st period and 2nd period classes. Use the graphs to answer problems 5-12. 1st Period Frequency 9 10-19 20-29 30-39 40-49 50-59 60-69 70-79 80-89 90-100 Test Scores (%) 2nd Period OHNWAMO V OOVO Frequency 0-9 10-19 20-29 30-39 40-49 50-59 60-69 70-79 80-89 90-100 Test Scores (%) 5. What measure of center and variance is best used to describe Mr. Mack's 1st period scores? Best measure of center: Best measure of variance: 6. What measure of center and variance is best used to describe Mr. Mack's 2nd period scores? Best measure of center: Best measure of variance: S(S) Geometry w/Da X @ Geometry w/Da X (8] Geometry w/Da X (5) 1203 Measure X Schoology X @ Schoology X * Course Hero Microsoft Word 0' bcbe.schoology.com 5/6) 0 149%0 7. Describe the data distribution of scores for the 15' period class. 8. Describe the data distribution of scores for the 2"\" period class. 9. Are the graphs of the scores centered in the same place? 10. Which class has the largest spread of distribution of scores? 11. Are the graphs of the scores centered in the same place? 12. Which class seem to have the highest scores
Step by Step Solution
There are 3 Steps involved in it

Get step-by-step solutions from verified subject matter experts