

Question: get data: Use the data in N_seaice_extent_daily_v3 . 0. csv to create and return a Series object. I suggest using read_csv, https://pandas.pydata.org/pandas- docs/stable/generated/pandas.read csv.html. You
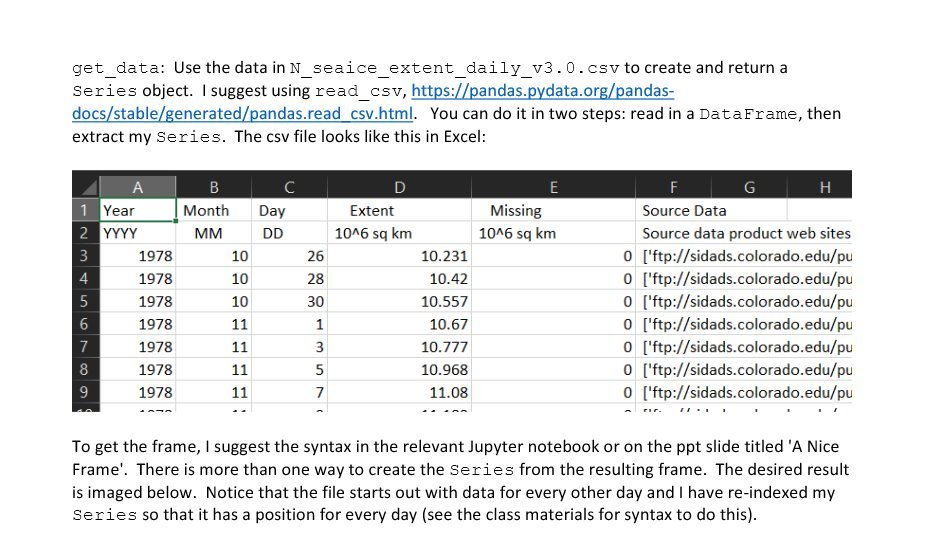
get data: Use the data in N_seaice_extent_daily_v3 . 0. csv to create and return a Series object. I suggest using read_csv, https://pandas.pydata.org/pandas- docs/stable/generated/pandas.read csv.html. You can do it in two steps: read in a DataFrame, then extract my Series. The csv file looks like this in Excel: A B C D E F G H 1 Year Month Day Extent Missing Source Data 2 YYYY MM DD 1046 sq km 1046 sq km Source data product web sites 3 1978 10 26 10.231 0 ['ftp://sidads.colorado.edu/pu 4 1978 10 28 10.42 0 ['ftp://sidads.colorado.edu/pu 5 1978 10 30 10.557 0 [ ftp://sidads.colorado.edu/pu 6 1978 11 1 10.67 0 ['ftp://sidads.colorado.edu/pu 1978 11 3 10.777 0 ['ftp://sidads.colorado.edu/pu 8 1978 11 5 10.968 0 ['ftp://sidads.colorado.edu/pu 1978 11 11.08 0 ['ftp://sidads.colorado.edu/pu To get the frame, I suggest the syntax in the relevant Jupyter notebook or on the ppt slide titled 'A Nice Frame'. There is more than one way to create the Series from the resulting frame. The desired result is imaged below. Notice that the file starts out with data for every other day and I have re-indexed my Series so that it has a position for every day (see the class materials for syntax to do this)
Step by Step Solution
There are 3 Steps involved in it

Get step-by-step solutions from verified subject matter experts