

Question: Get the Gizmo ready: Activity C: 0 Click the button to reset the graph. 0 On the CONTROLS tab, set a to 0.0, b to
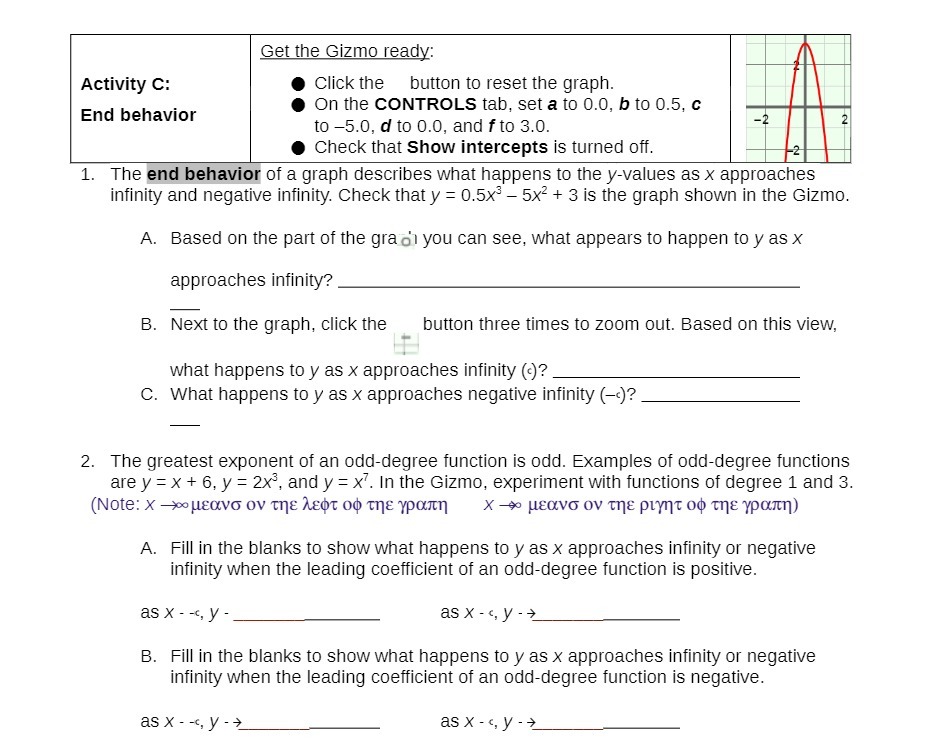
Get the Gizmo ready: Activity C: 0 Click the button to reset the graph. 0 On the CONTROLS tab, set a to 0.0, b to 0.5, e to 5.0, d to 0.0, and fto 3.0. 0 Check that Show intercepts is turned o. 1. The of a graph describes what happens to the yvalues as x approaches innity and negative innity. Check thaty = 0.5x3 51:2 + 3 is the graph shown in the Gizmo. End behavior A. Based on the part of the gra 9'1 you can see, what appears to happen to y as x approaches innity? B. Ext to the graph, click the button three times to zoom out. Based on this view, I- what happens to y as x approaches infinity (c)? C. What happens to y as x approaches negative infinity (c)? 2. The greatest exponent of an odddegree function is odd. Examples of odddegree functions are y : x + E. y : 2x3, and y : x? In the Gizmo, experiment with functions of degree 1 and 3. (Note: X ammo ov me 1.9411 04} \"ms worm] x o psowo ov me pnrrrr o mswm) A. Fill in the blanks to show what happens to y as x approaches infinity or negative innity when the leading coefficient of an odddegree function is positive. asx-4,y asx
Step by Step Solution
There are 3 Steps involved in it

Get step-by-step solutions from verified subject matter experts