

Question: ggplot2 package https://www.chegg.com/homework-help/questions-and-answers/ggplot-please-answer-r-studio-note-needed-data-link-https-githubcom-wampeh1-ecog314spring2-q20106881 https://www.chegg.com/homework-help/questions-and-answers/ggplot-package-parts-e-f-g-h-question-https-wwwcheggcom-homework-help-questions-answers-gg-q20274923 R STUDIO ! Please answer by R studio. NOTE : The needed data are in this link: https://github.com/wampeh1/Ecog314_Spring2017/tree/master/lecture7 This could not
ggplot2 package
https://www.chegg.com/homework-help/questions-and-answers/ggplot-please-answer-r-studio-note-needed-data-link-https-githubcom-wampeh1-ecog314spring2-q20106881
https://www.chegg.com/homework-help/questions-and-answers/ggplot-package-parts-e-f-g-h-question-https-wwwcheggcom-homework-help-questions-answers-gg-q20274923
R STUDIO !
Please answer by R studio.
NOTE : The needed data are in this link:
https://github.com/wampeh1/Ecog314_Spring2017/tree/master/lecture7
This could not be answered without R studio
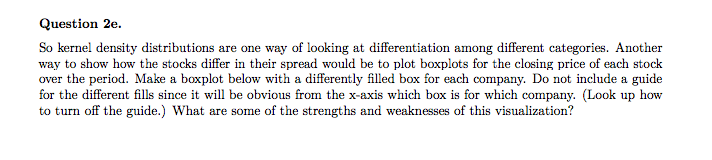
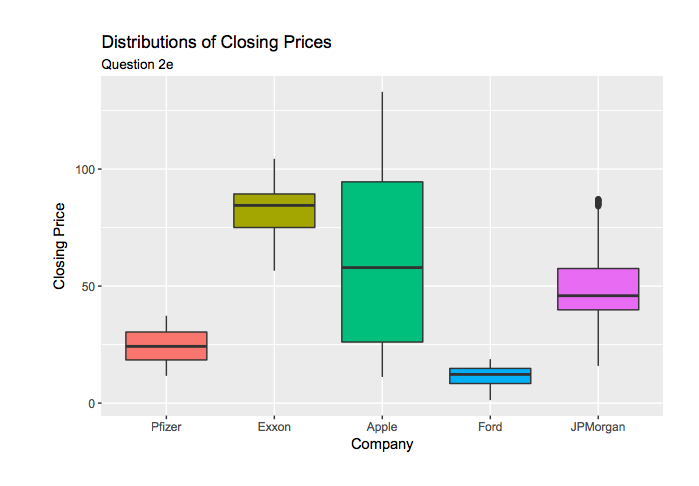
Question 2e So kernel density distributions are one way of looking at differentiation among different categories. Another way to show how the stocks differ in their spread would be to plot boxplots for the closing price of each stock over the period. Make a boxplot below with a differently filled box for each company. Do not include a guide for the different fills since it will be obvious from the x-axis which box is for which company. (Look up how to turn off the guide.) What are some of the strengths and weaknesses of this visualization? Question 2e So kernel density distributions are one way of looking at differentiation among different categories. Another way to show how the stocks differ in their spread would be to plot boxplots for the closing price of each stock over the period. Make a boxplot below with a differently filled box for each company. Do not include a guide for the different fills since it will be obvious from the x-axis which box is for which company. (Look up how to turn off the guide.) What are some of the strengths and weaknesses of this visualizationStep by Step Solution
There are 3 Steps involved in it
1 Expert Approved Answer
Step: 1 Unlock

Question Has Been Solved by an Expert!
Get step-by-step solutions from verified subject matter experts
Step: 2 Unlock
Step: 3 Unlock