

Question: ggplot R STUDIO ! (ggplot) Please answer by R studio. NOTE : The needed data are in this link: https://github.com/wampeh1/Ecog314_Spring2017/tree/master/lecture7 This could not be answered
ggplot
R STUDIO !
(ggplot) Please answer by R studio.
NOTE : The needed data are in this link:
https://github.com/wampeh1/Ecog314_Spring2017/tree/master/lecture7
This could not be answered without R studio
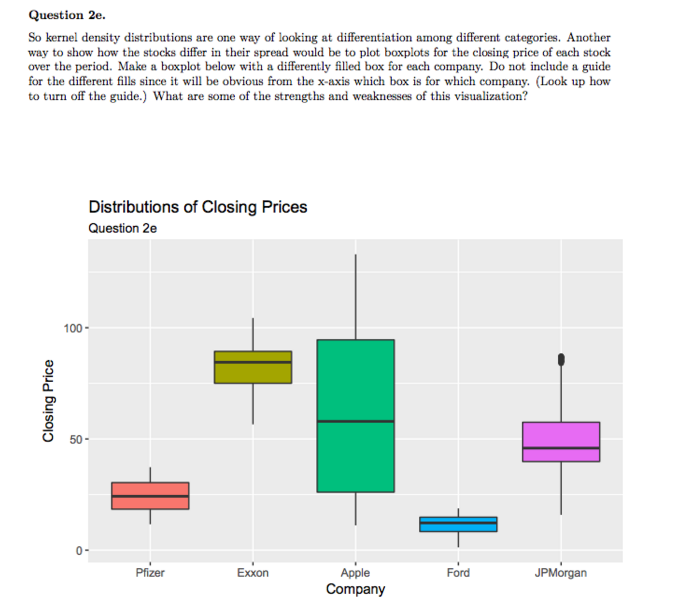
Question 2e. So kernel density distributions are one way of looking at differentiation among different categories. Another way to show how the stocks differ in their spread would be to plot boxplots for the closing price of each stock over the period. Make a boxplot below with a differently filled box for each company. Do not include a guide for the different fills since it will be obvious from the x-axis which box is for which company. (Look up how to turn off the guide.) What are some of the strengths and weaknesses of this visualization? Distributions of Closing Prices Question 2e 100 50- Exxon Apple Ford JPMorgan Pfizer Company Question 2e. So kernel density distributions are one way of looking at differentiation among different categories. Another way to show how the stocks differ in their spread would be to plot boxplots for the closing price of each stock over the period. Make a boxplot below with a differently filled box for each company. Do not include a guide for the different fills since it will be obvious from the x-axis which box is for which company. (Look up how to turn off the guide.) What are some of the strengths and weaknesses of this visualization? Distributions of Closing Prices Question 2e 100 50- Exxon Apple Ford JPMorgan Pfizer Company
Step by Step Solution
There are 3 Steps involved in it

Get step-by-step solutions from verified subject matter experts