

Question: Give comments and Recommendations for these Ratio Analysis for 2019 and 2020 Ratio analysis for Gemini sea foods limited Activity ratio Inventory tumover = sales
Give comments and Recommendations for these Ratio Analysis for 2019 and 2020
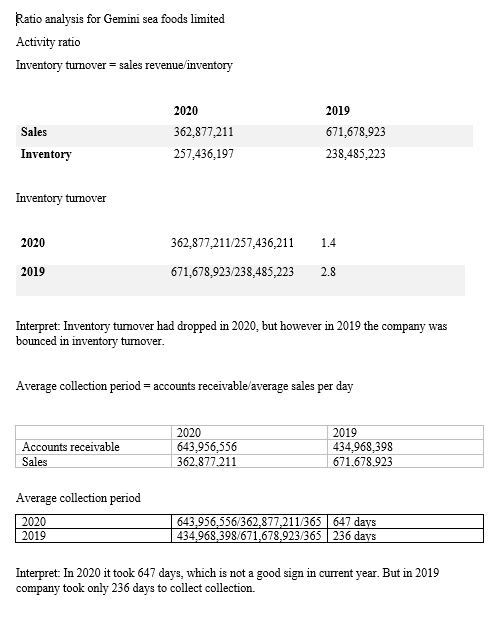
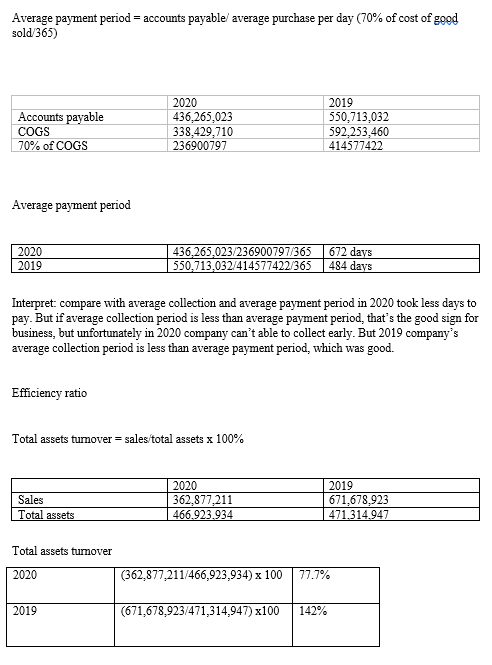
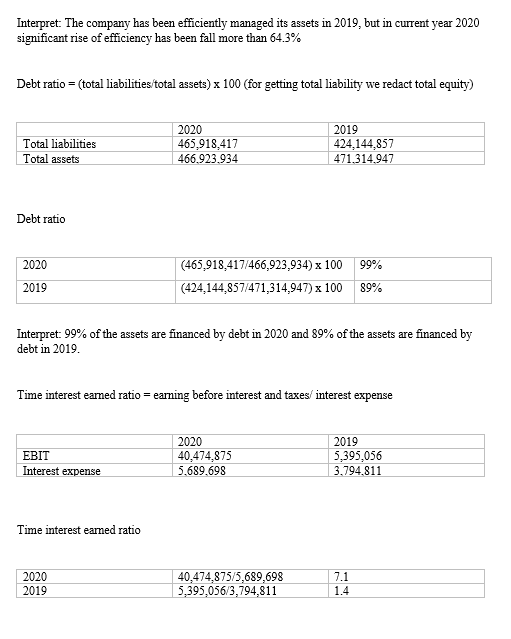
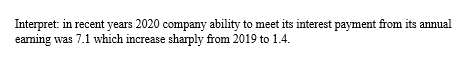
Ratio analysis for Gemini sea foods limited Activity ratio Inventory tumover = sales revenue inventory Sales 2020 362,877,211 257,436,197 2019 671,678,923 238,485,223 Inventory Inventory turnover 2020 362,877,211/257,436,211 1.4 2019 671,678,923/238,485,223 2.8 Interpret: Inventory tumover had dropped in 2020, but however in 2019 the company was bounced in inventory turnover. Average collection period = accounts receivable average sales per day Accounts receivable Sales 2020 643,956,556 362.877.211 2019 434,968,398 671.678.923 Average collection period 2020 2019 643,956,556/362,877,211/365 647 days 434.968,398/671,678,923/365 236 days Interpret: In 2020 it took 647 days, which is not a good sign in current year. But in 2019 company took only 236 days to collect collection. Average payment period = accounts payable average purchase per day (70% of cost of good sold/365) Accounts payable COGS 70% of COGS 2020 436,265,023 338,429,710 236900797 2019 550,713,032 592,253,460 414577422 Average payment period 2020 2019 436.265,023/236900797/365 550,713,032/414577422/365 672 days 484 days Interpret: compare with average collection and average payment period in 2020 took less days to pay. But if average collection period is less than average payment period, that's the good sign for business, but unfortunately in 2020 company can't able to collect early. But 2019 company's average collection period is less than average payment period, which was good. Efficiency ratio Total assets turnover = sales total assets x 100% Sales Total assets 2020 362,877,211 466.923,934 2019 671,678,923 471.314.947 Total assets tumover 2020 (362,877,211/466,923,934) x 100 77.7% 2019 (671,678,923/471,314,947) x100 142% Interpret: The company has been efficiently managed its assets in 2019, but in current year 2020 significant rise of efficiency has been fall more than 64.3% Debt ratio = (total liabilities total assets) x 100 (for getting total liability we redact total equity) 2019 Total liabilities Total assets 2020 465,918,417 466.923.934 424,144,857 471.314.947 Debt ratio 2020 99% (465,918,417/466,923,934) x 100 (424,144,857/471,314,947) x 100 2019 89% Interpret: 99% of the assets are financed by debt in 2020 and 89% of the assets are financed by debt in 2019. Time interest eamed ratio = earning before interest and taxes/ interest expense EBIT Interest expense 2020 40,474,875 5.689.698 2019 5,395,056 3.794.811 Time interest earned ratio 7.1 2020 2019 40,474,875/5,689,698 5,395,056/3,794,811 1.4 Interpret: in recent years 2020 company ability to meet its interest payment from its annual earning was 7.1 which increase sharply from 2019 to 1.4
Step by Step Solution
There are 3 Steps involved in it

Get step-by-step solutions from verified subject matter experts