

Question: Give explanation Given observations from a reasonably normally distributed population, test the hypothesis that the population variance is 9 against the twosided alternative using a
Give explanation
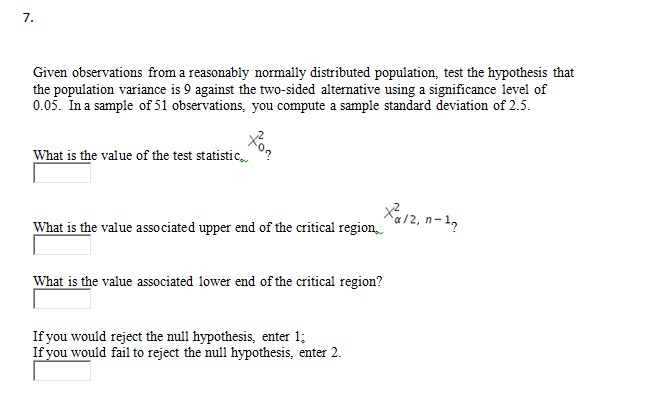
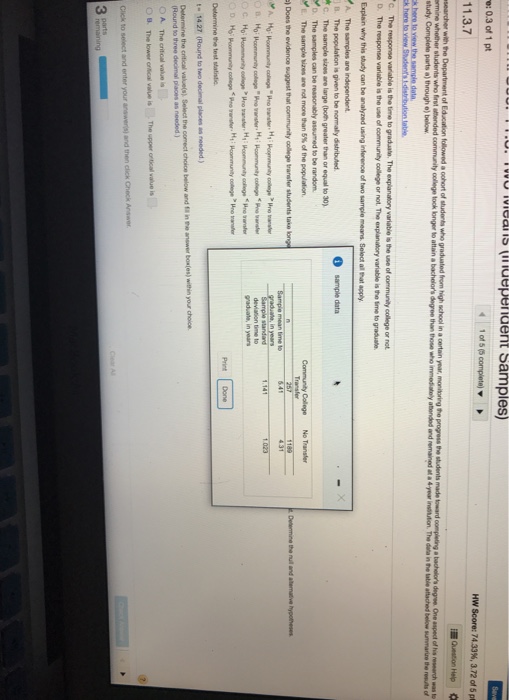
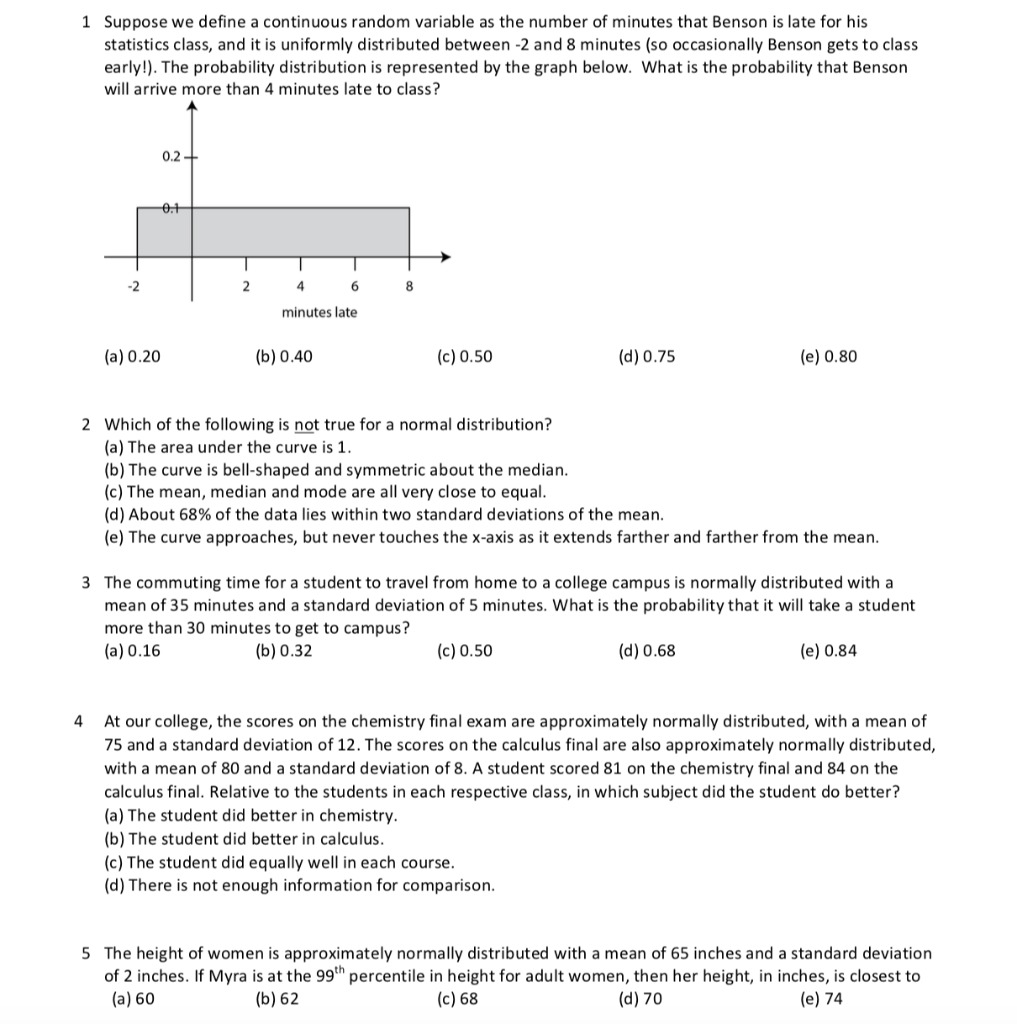
Given observations from a reasonably normally distributed population, test the hypothesis that the population variance is 9 against the twosided alternative using a signicance level of GLIDE. In a sample of 51 observations, you compute a sample standard deviation of 2.5. X2 was is the value of the test statistieh \"a ' X2 What is the value associated upper end of the critical regionh \"2' n ' 1'? l 1|What is the value associated lower end of the critical region? I If you would reject the null hypothesis, enter 1; If you would fail to reject the null hypothesis, enter 2. dependent Samples) 0: 0.3 of 1 pt 1 of 5 (5 comphoto] 11.3.7 HW Score: 74.39%%, 3.72 of 5p Question Help searchor with the Department of Education followed a cohort of students who graduated from high school in a certain year, monitoring the progress the students made toward completing a bachelor's degree. One anpool of his research mus to armine whothor students who first attended community college took longer to attain a bachelor's dagree the those who immediately attended and remained of a $ your Institution. The data in the table attached below summarize the moguls of study. Complain parts a) through a) bulow, k hoco lo view the sample data ck hore to view Student's 1-distribution table. C. The response variable is the time to graduate, The explanatory variable is the use of community college or not. D. The response variable is the use of community college or not. The explanatory variable is the time to graduate. Explain why this study can be analyzed using inforonco of two sample means. Bolot all Put apply. The samples are Independent. B. The population is given to be normally distributed. Sample data C. The sample sizes are large (both greater than or equal to 30). "D. The samples can be reasonably assumed to bo random. "E. The sample sizes are not more than 5% of the population. Community College No Transtar Transfer Does the evidence suggest that community college barfor students take long Ramplo mein time Is LET A. He: Humanity college "Pro barter: Hi Poommanity collage " Ing tester graduate, in years Sample mandard 1.141 deviation time to Print Done Determine the tout whatislic. 1= 14.27 (Round to two docknal places in nooded. ) Determine the critical valveisk Select the correct choice below and I In the answer bosjes) within your choice. [Found to three decimal places as needed } O A The aritod who ha OF The bower offical value is The upper critical value is Click to select and enter your answers] and then click Chuck Answer. Clear All parts remaining1 Suppose we dene a continuous random variable as the number of minutes that Benson is late for his statistics class, and it is uniformly distributed between -2 and 8 minutes {so occasionally Benson gets to class earlyl}. The probability distribution is represented by the graph below. What is the probability that Benson will arrive more than 4 minutes late to class? 0.2 -2 2 4 6 8 minutes late {a} 0.20 {010.40 lc) 0.50 id) 0.75 {e} 0.00 2 Which of the following is mt true for a normal distribution? {a} The area under the curve is 1. {biThe curve is bell-shaped and symmetric about the median. {cl The mean, median and mode are all very close to equal. id) About 68% of the data lies within two standard deviations of the mean. (e) The curve approaches, but never touches the x-axis as it extends farther and farther from the mean. 3 The commuting time for a student to travel from home to a college campus is normally distributed with a mean of 35 minutes and a standard deviation of 5 minutes. What is the probability that it will take a student more than 30 minutes to get to campus? la) 0.16 {010.32 [cl 0.50 {d10.68 lo) 0.84 it At our college, the scores on the chemistry nal exam are approximately normally distributed, with a mean of 75 and a standard deviation of 12. The scores on the calculus final are also approximately normally distributed. with a mean of 80 and a standard deviation of 8. A student scored 81 on the chemistry final and 84 on the calculus final. Relative to the students in each respective class. in which subject did the student do better? la) The student did better in chemistry. {biThe student did better in calculus. {cl The student did equally well in each course. {d) There is not enough information for comparison. 5 The height of women is approximately normally distributed with a mean of 65 inches and a standard deviation of 2 inches. If Myra is at the 99"\" percentile in height for adult women, then her height. in inches, is closest to {a} 60 (b) 62 [c168 [d] 70 (e) 74
Step by Step Solution
There are 3 Steps involved in it

Get step-by-step solutions from verified subject matter experts