

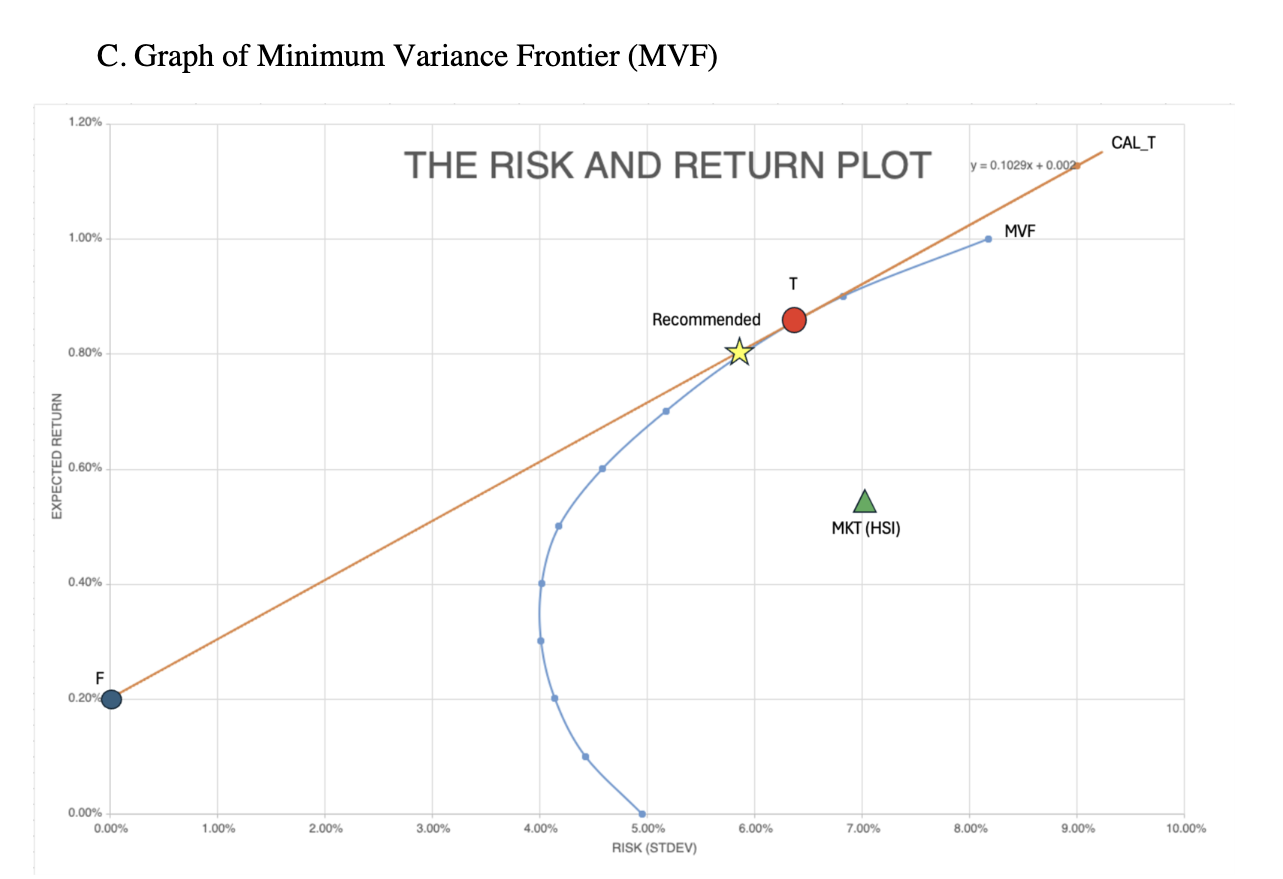
Question: give me a short description for this graph C. Graph of Minimum Variance Frontier (MVF) 1.20% CAL_T THE RISK AND RETURN PLOT y = 0.1029x
give me a short description for this graph
Step by Step Solution
There are 3 Steps involved in it
1 Expert Approved Answer
Step: 1 Unlock

Question Has Been Solved by an Expert!
Get step-by-step solutions from verified subject matter experts
Step: 2 Unlock
Step: 3 Unlock