

Question: Given a control system shown in Figure Q5, answer the following questions: (a) ( Using the asymptotic approximation method, draw the Bode plot of the
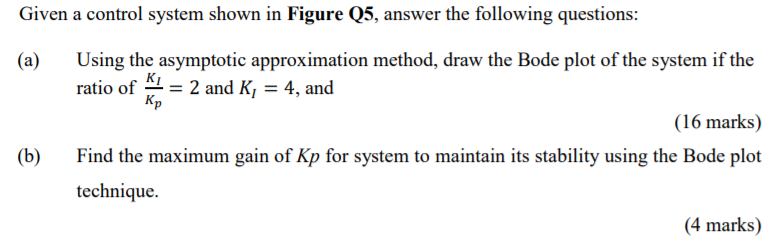
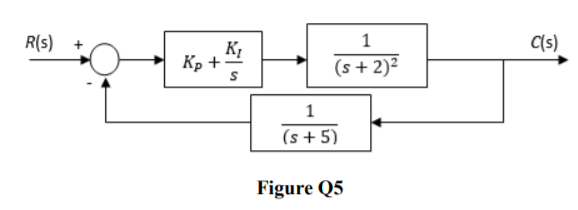
Given a control system shown in Figure Q5, answer the following questions: (a) ( Using the asymptotic approximation method, draw the Bode plot of the system if the ratio of K1 = 2 and K, = 4, and Kp (16 marks) (6) Find the maximum gain of Kp for system to maintain its stability using the Bode plot technique. (4 marks) R(s) Cls) K; Rp + 1 (s + 2)2 1 (s +5) Figure Q5
Step by Step Solution
There are 3 Steps involved in it
1 Expert Approved Answer
Step: 1 Unlock

Question Has Been Solved by an Expert!
Get step-by-step solutions from verified subject matter experts
Step: 2 Unlock
Step: 3 Unlock