

Question: Given a csv file with numerical data, I would like to plot one row of data as X - axis, one column of data as
Given a csv file with numerical data, I would like to plot one row of data as Xaxis, one column of data as Yaxis and generate a XY plot using Python. Please provide the Python code. Thanks.
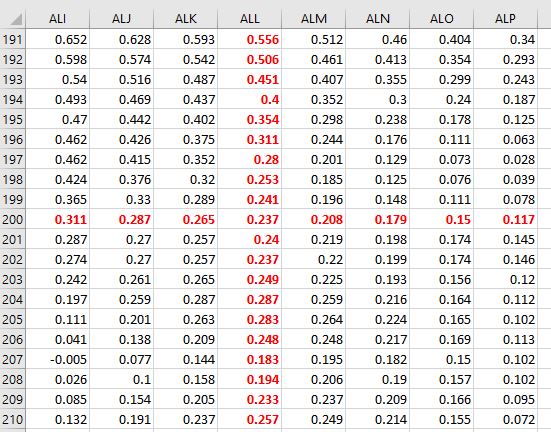
What if there is no rowname and columnname in the cvs file? All I know is I like to plot row and column 'ALL' similar to what you see below in an Excel file.
tableALIALJ,ALK,ALL,ALM,ALN,ALO,ALP
Step by Step Solution
There are 3 Steps involved in it
1 Expert Approved Answer
Step: 1 Unlock

Question Has Been Solved by an Expert!
Get step-by-step solutions from verified subject matter experts
Step: 2 Unlock
Step: 3 Unlock