

Question: Given actual sales data during the last three years (12 quarters, labeled as Periods 1-12), a regression analysis that considers seasonality with an additive form
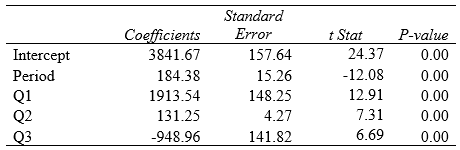
Given actual sales data during the last three years (12 quarters, labeled as Periods 1-12), a regression analysis that considers seasonality with an additive form (i.e., defining quarters as dummy variables, Q1, Q2, and Q3) has been conducted to forecast the demand in this year with the following Excel output. Figure 3 What is the demand forecast for quarter 3 of this year?
10109
8152
7385
5658
Intercept Period Q1 Q2 Q3 Coefficients 3841.67 184.38 1913.54 131.25 -948.96 Standard Error 157.64 15.26 148.25 4.27 141.82 t Stat 24.37 -12.08 12.91 7.31 6.69 P-value 0.00 0.00 0.00 0.00 0.00Step by Step Solution
There are 3 Steps involved in it
1 Expert Approved Answer
Step: 1 Unlock

Question Has Been Solved by an Expert!
Get step-by-step solutions from verified subject matter experts
Step: 2 Unlock
Step: 3 Unlock