

Question: Given are five observations for two variables, and y. 1 2 3 4 5 3 7 6 9 14 a. Which of the following scatter
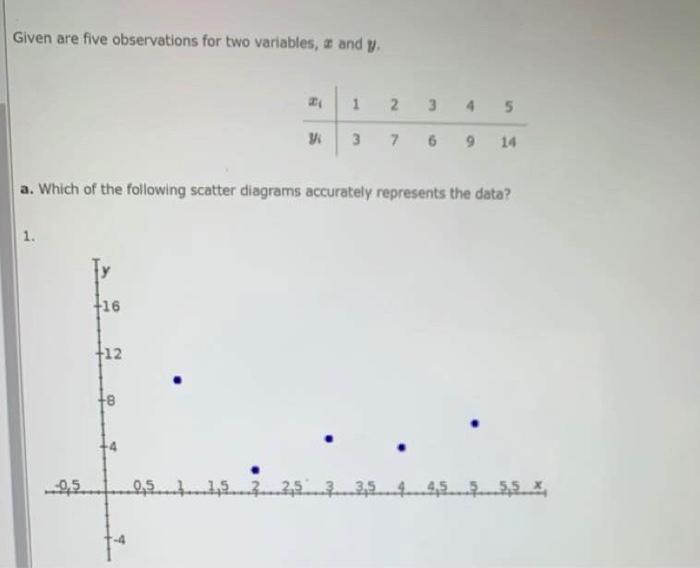
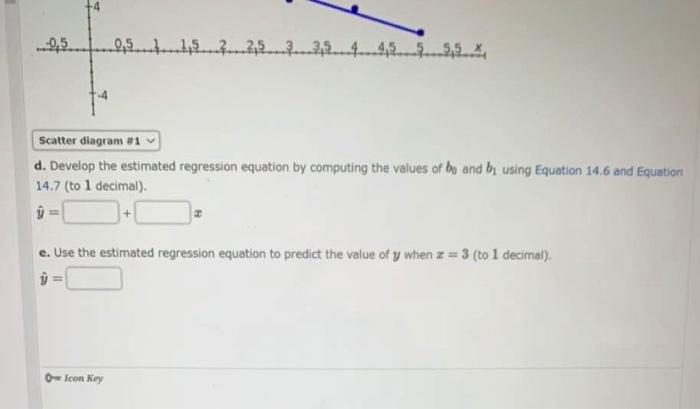
Given are five observations for two variables, and y. 1 2 3 4 5 3 7 6 9 14 a. Which of the following scatter diagrams accurately represents the data? 1. +16 +12 +8 0,5 0,5 45 -0.5 0,5... ...2,5...2..3...4...4,5...5,5... Scatter diagram #1 d. Develop the estimated regression equation by computing the values of bo and by using Equation 14.6 and Equation 14.7 (to 1 decimal). e. Use the estimated regression equation to predict the value of y when z = 3 (to 1 decimal), 0-lcon Koy
Step by Step Solution
There are 3 Steps involved in it
1 Expert Approved Answer
Step: 1 Unlock

Question Has Been Solved by an Expert!
Get step-by-step solutions from verified subject matter experts
Step: 2 Unlock
Step: 3 Unlock