

Question: Given are five observations for two variables, x and y. begin{tabular}{|c|c|c|c|c|c|} hlinexi & 1 & 2 & 3 & 4 & 5 hline yi
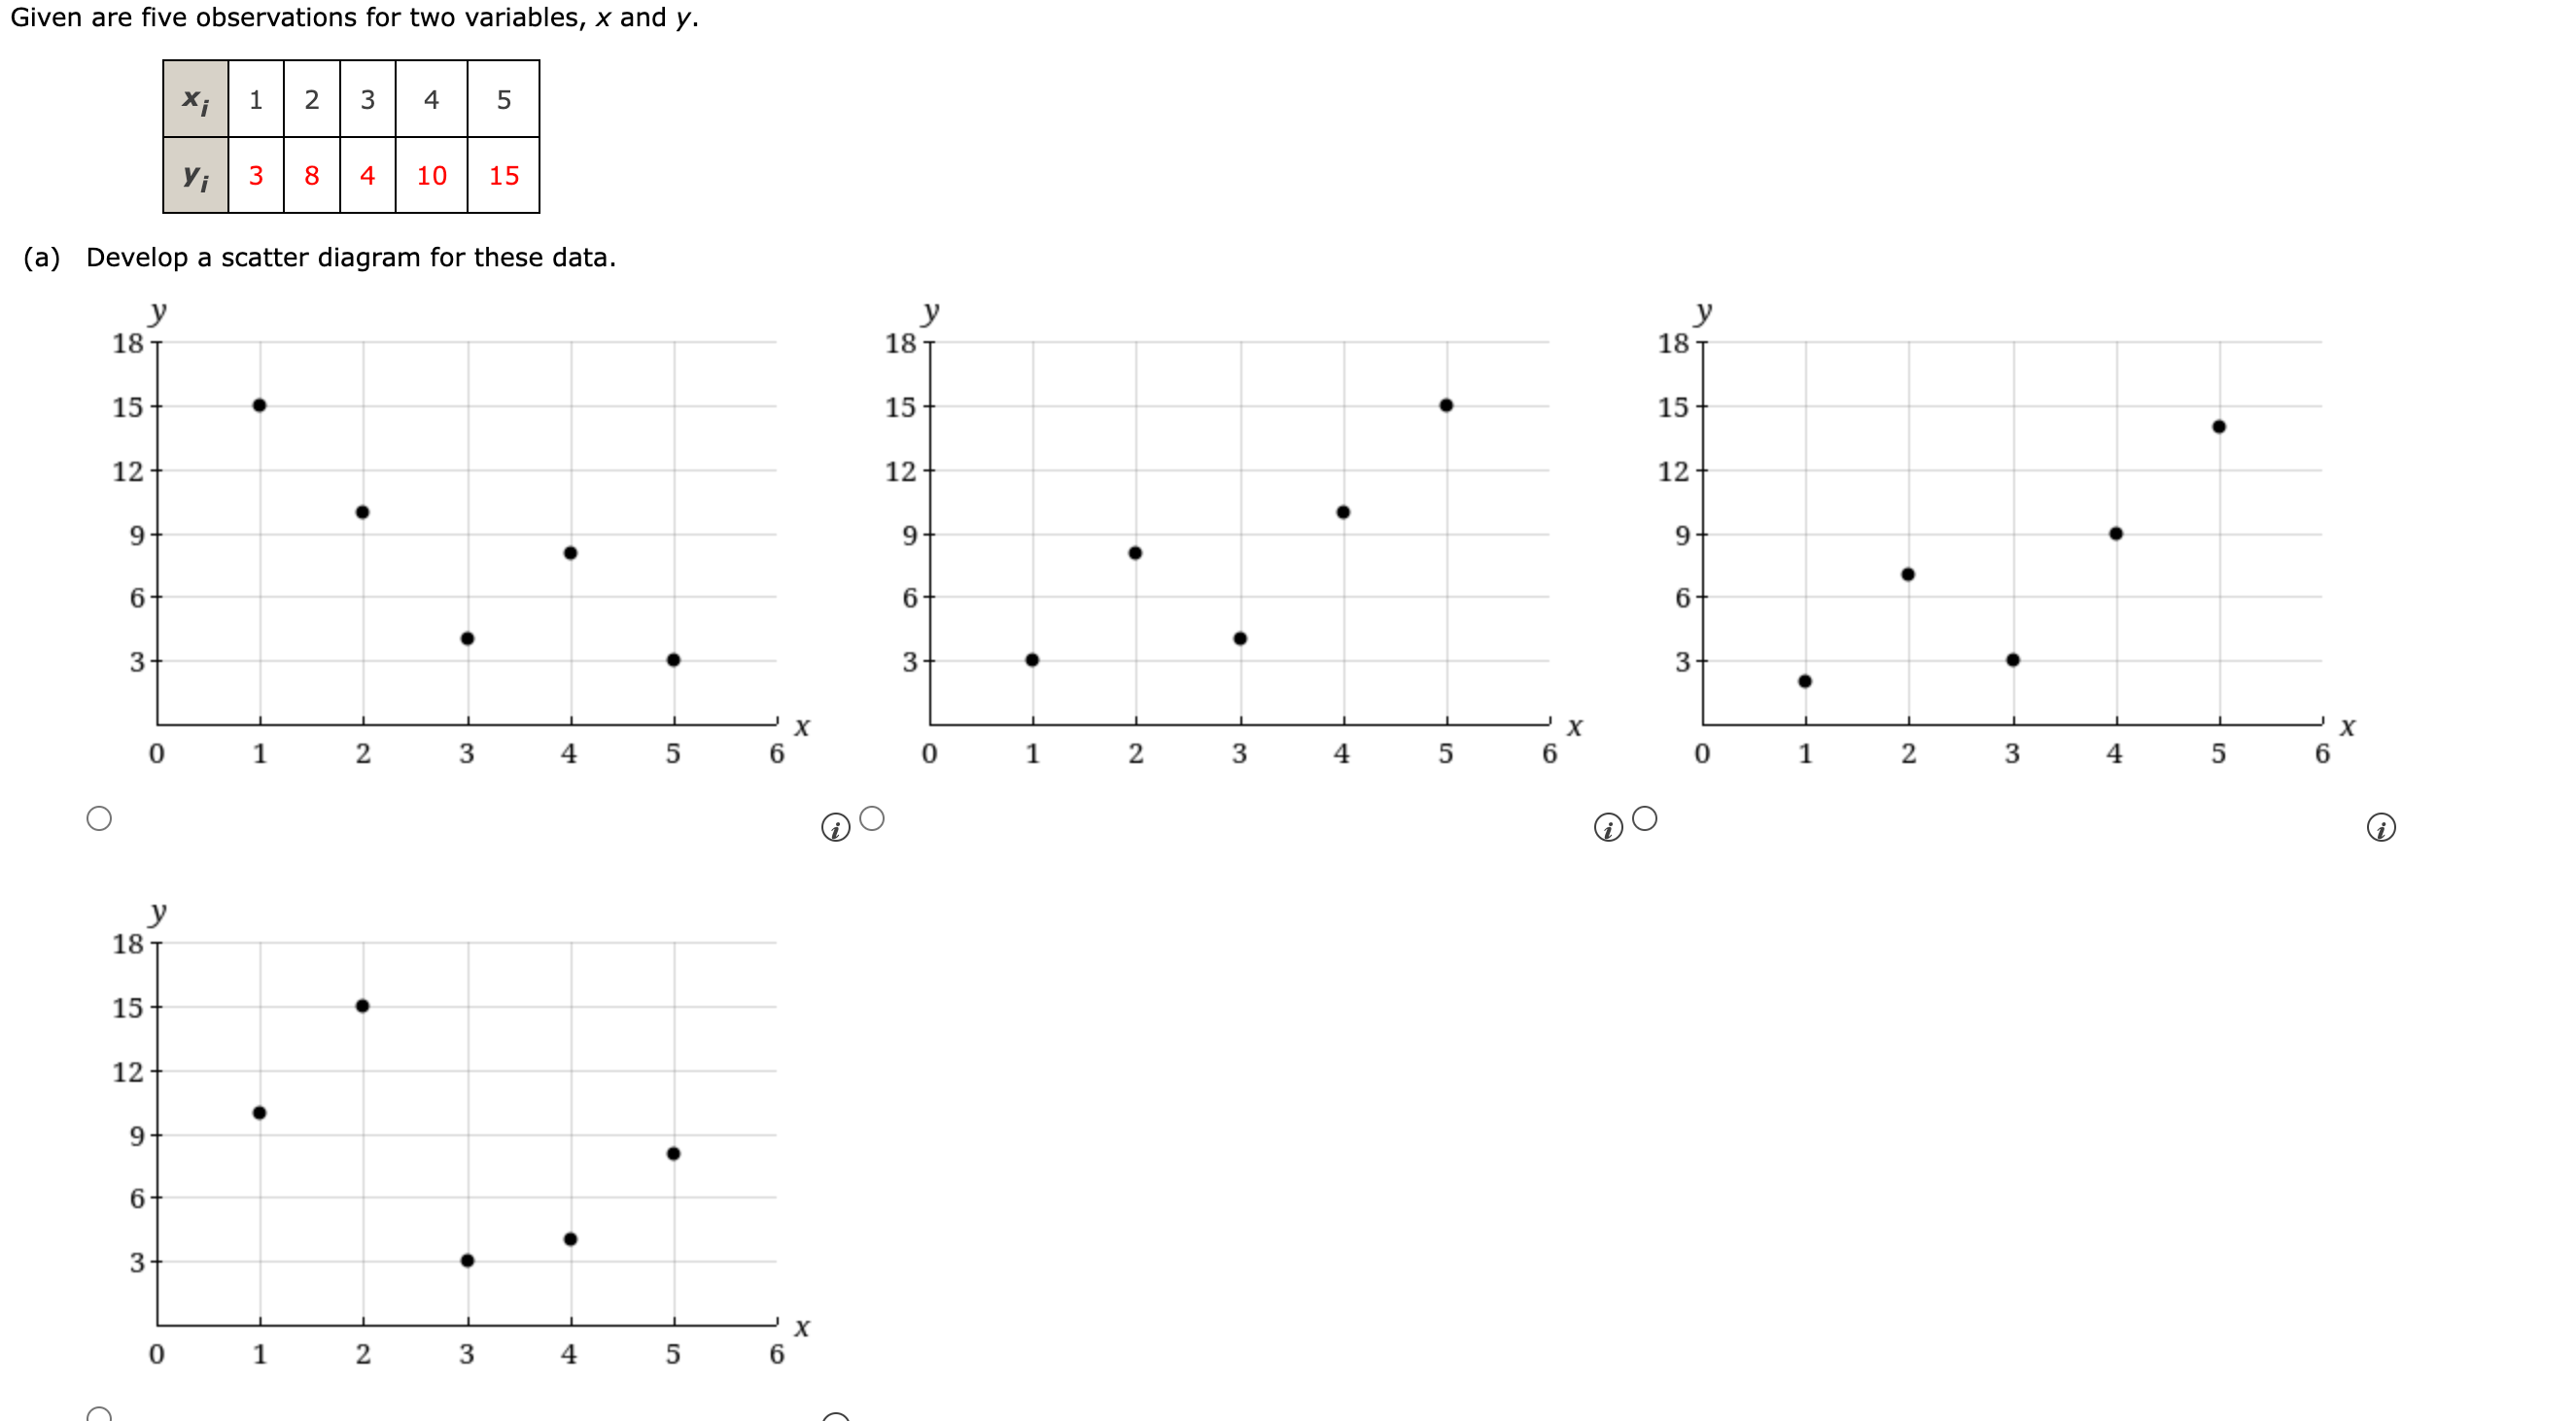
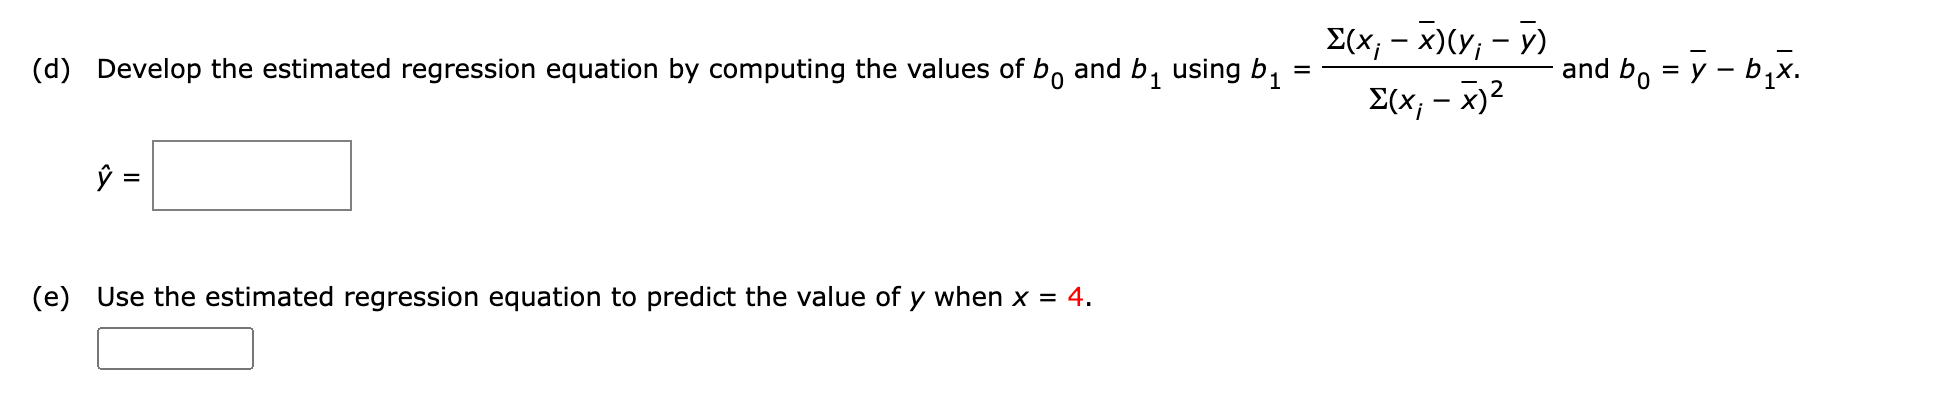
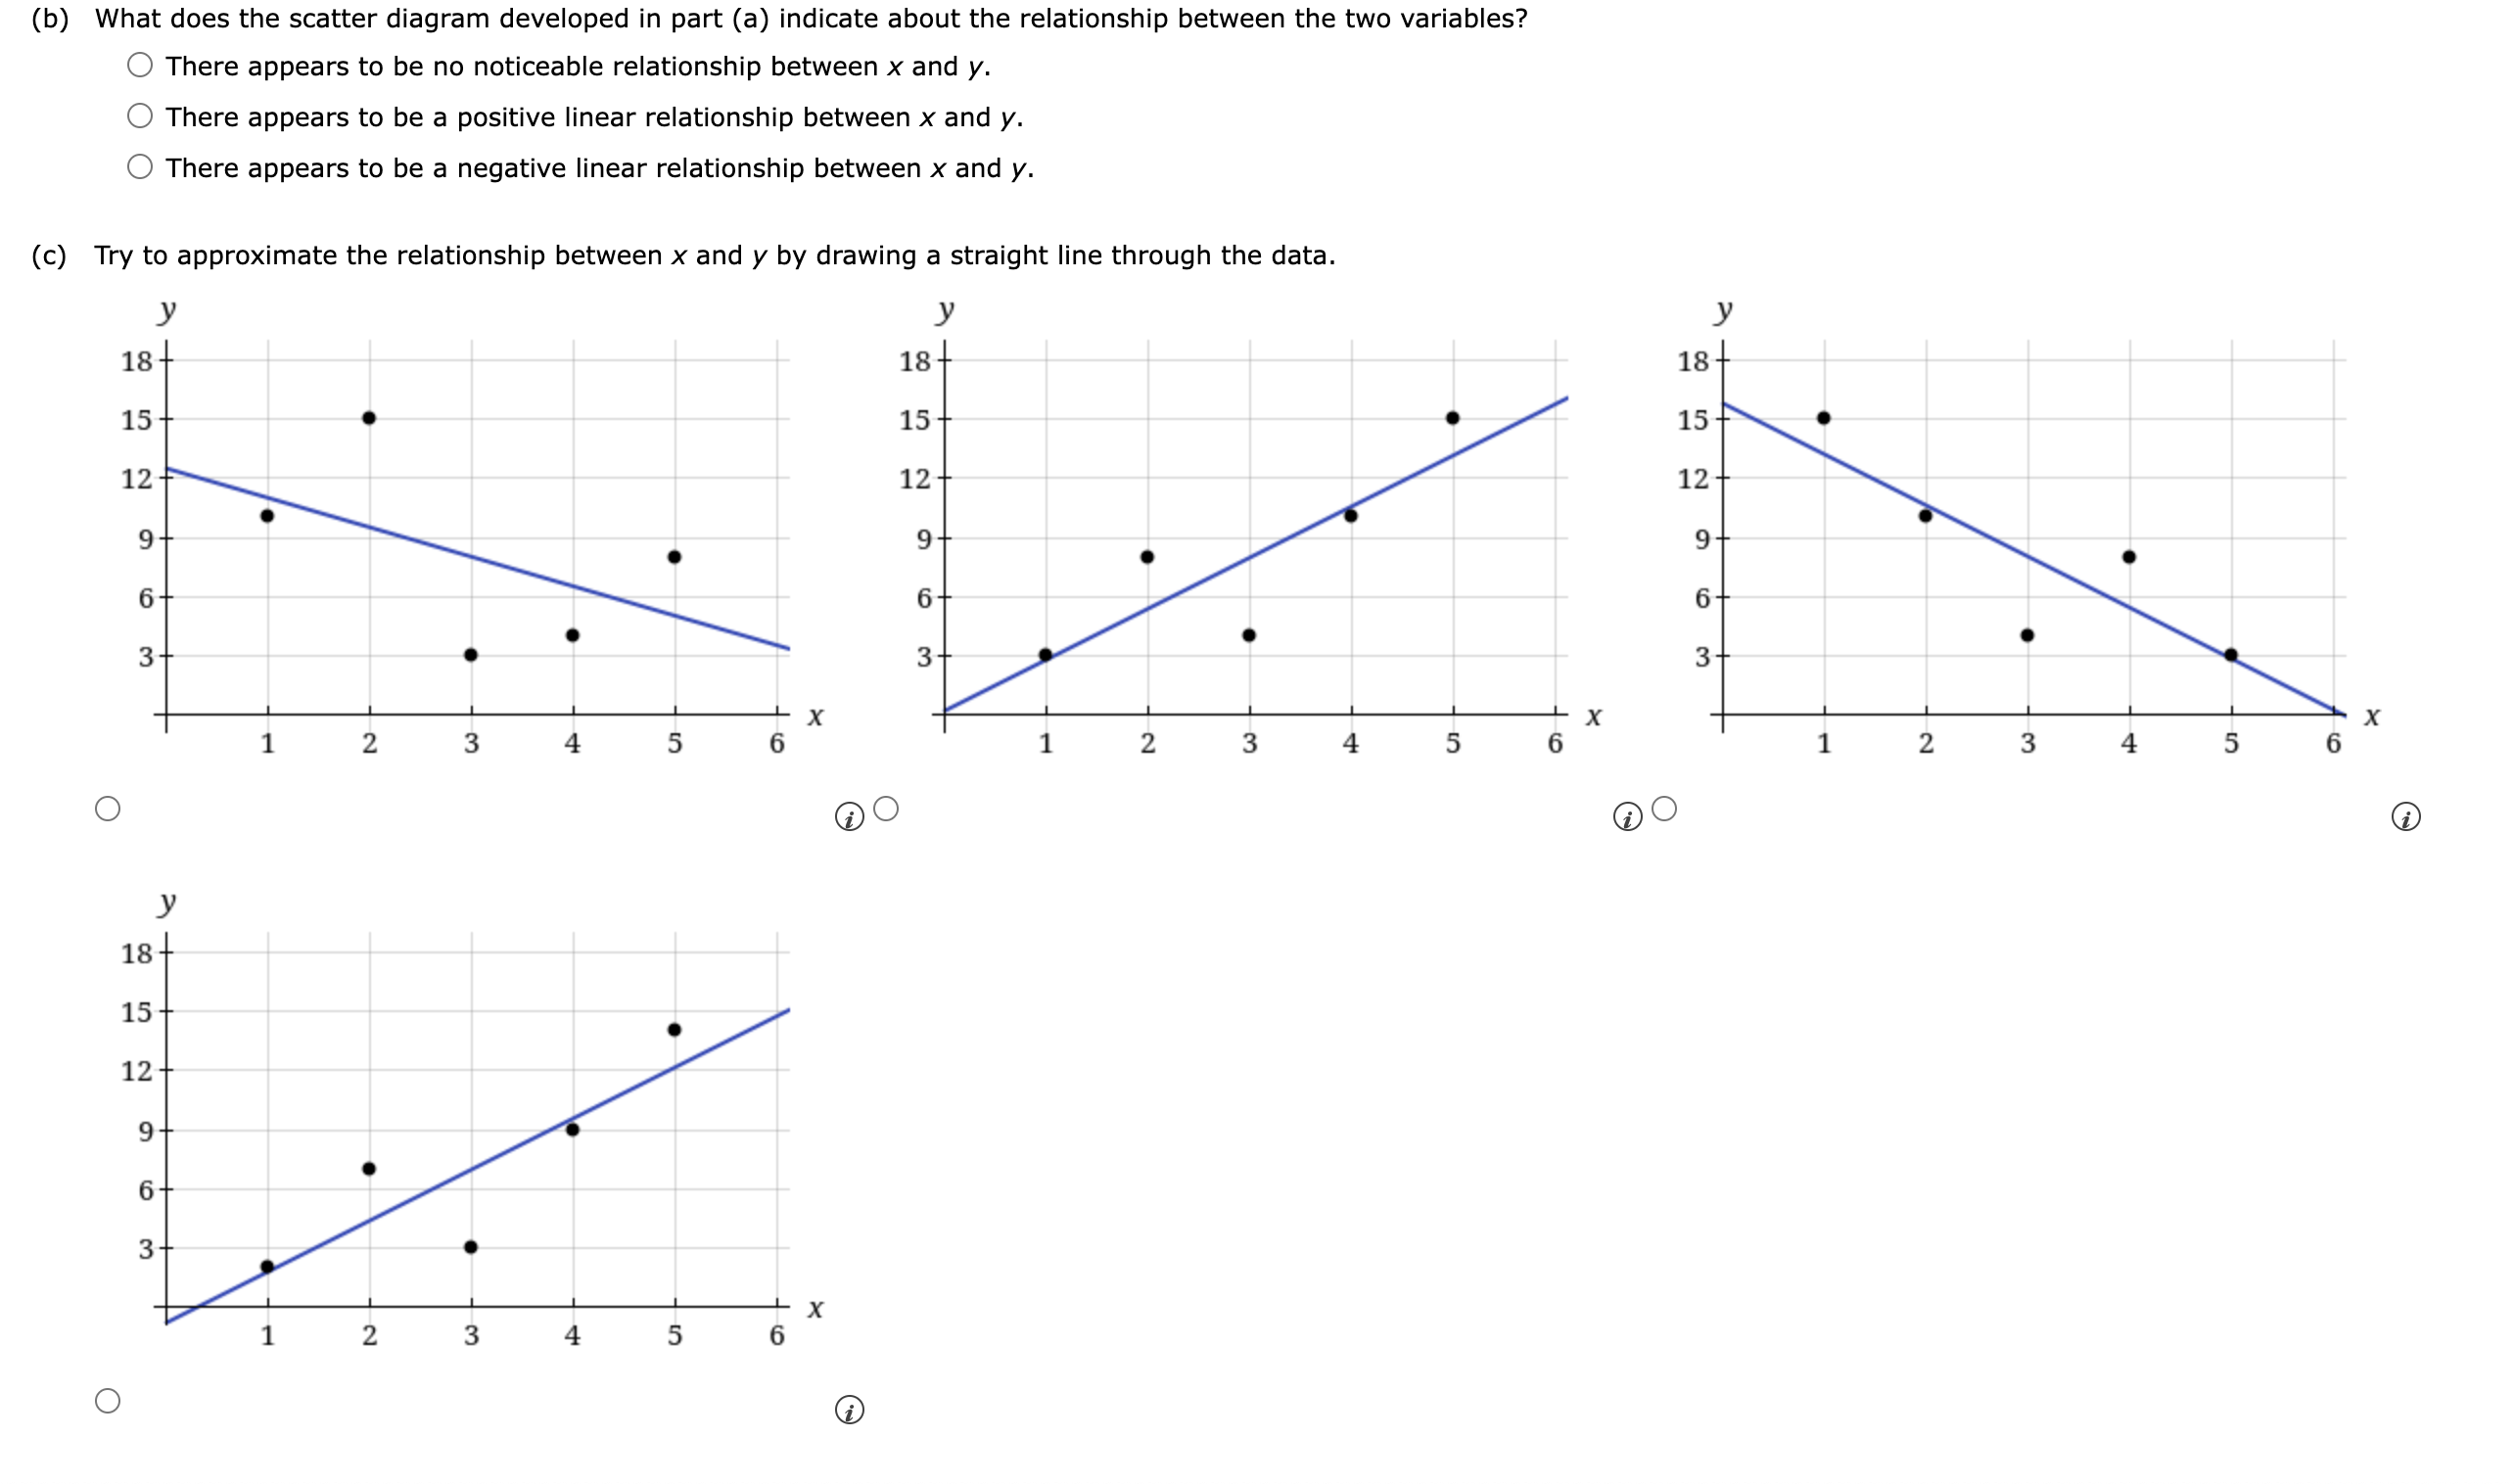
Given are five observations for two variables, x and y. \begin{tabular}{|c|c|c|c|c|c|} \hlinexi & 1 & 2 & 3 & 4 & 5 \\ \hline yi & 3 & 8 & 4 & 10 & 15 \\ \hline \end{tabular} (a) Develop a scatter diagram for these data. (b) What does the scatter diagram developed in part (a) indicate about the relationship between the two variables? There appears to be no noticeable relationship between x and y. There appears to be a positive linear relationship between x and y. There appears to be a negative linear relationship between x and y. (d) Develop the estimated regression equation by computing the values of b0 and b1 using b1=(xix)2(xix)(yiy) and b0=yb1x. y^= (e) Use the estimated regression equation to predict the value of y when x=4
Step by Step Solution
There are 3 Steps involved in it

Get step-by-step solutions from verified subject matter experts