

Question: Given are five observations for two variables, x and y. X ; 1 2 3 4 5 10 (a) Develop a scatter diagram for these
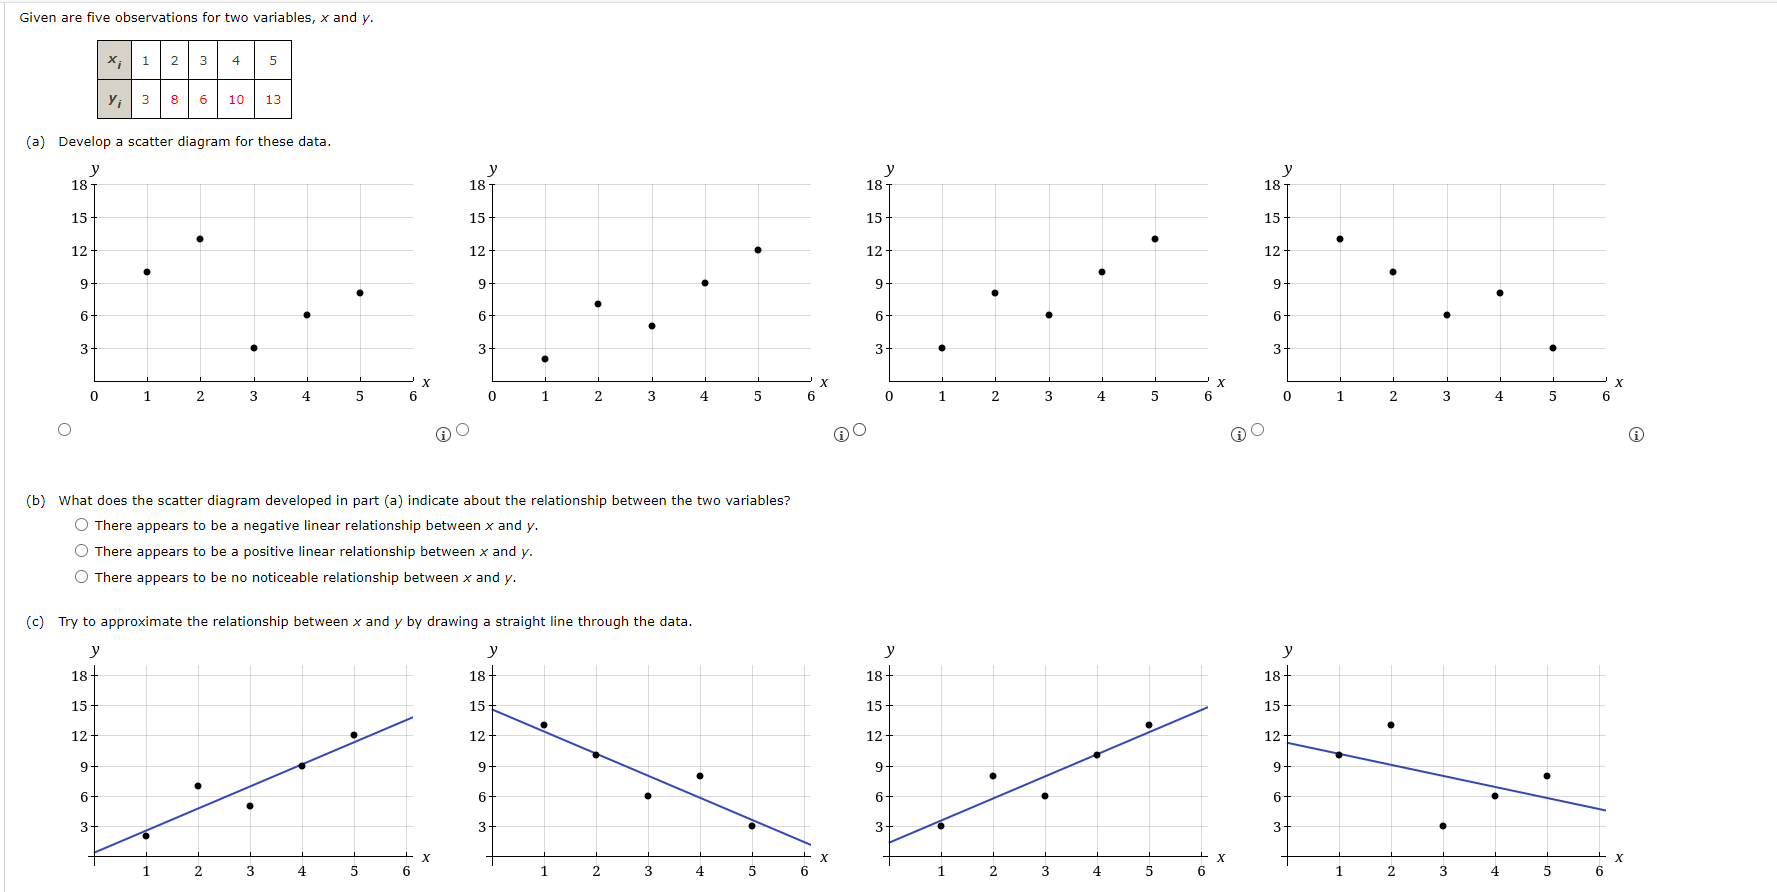

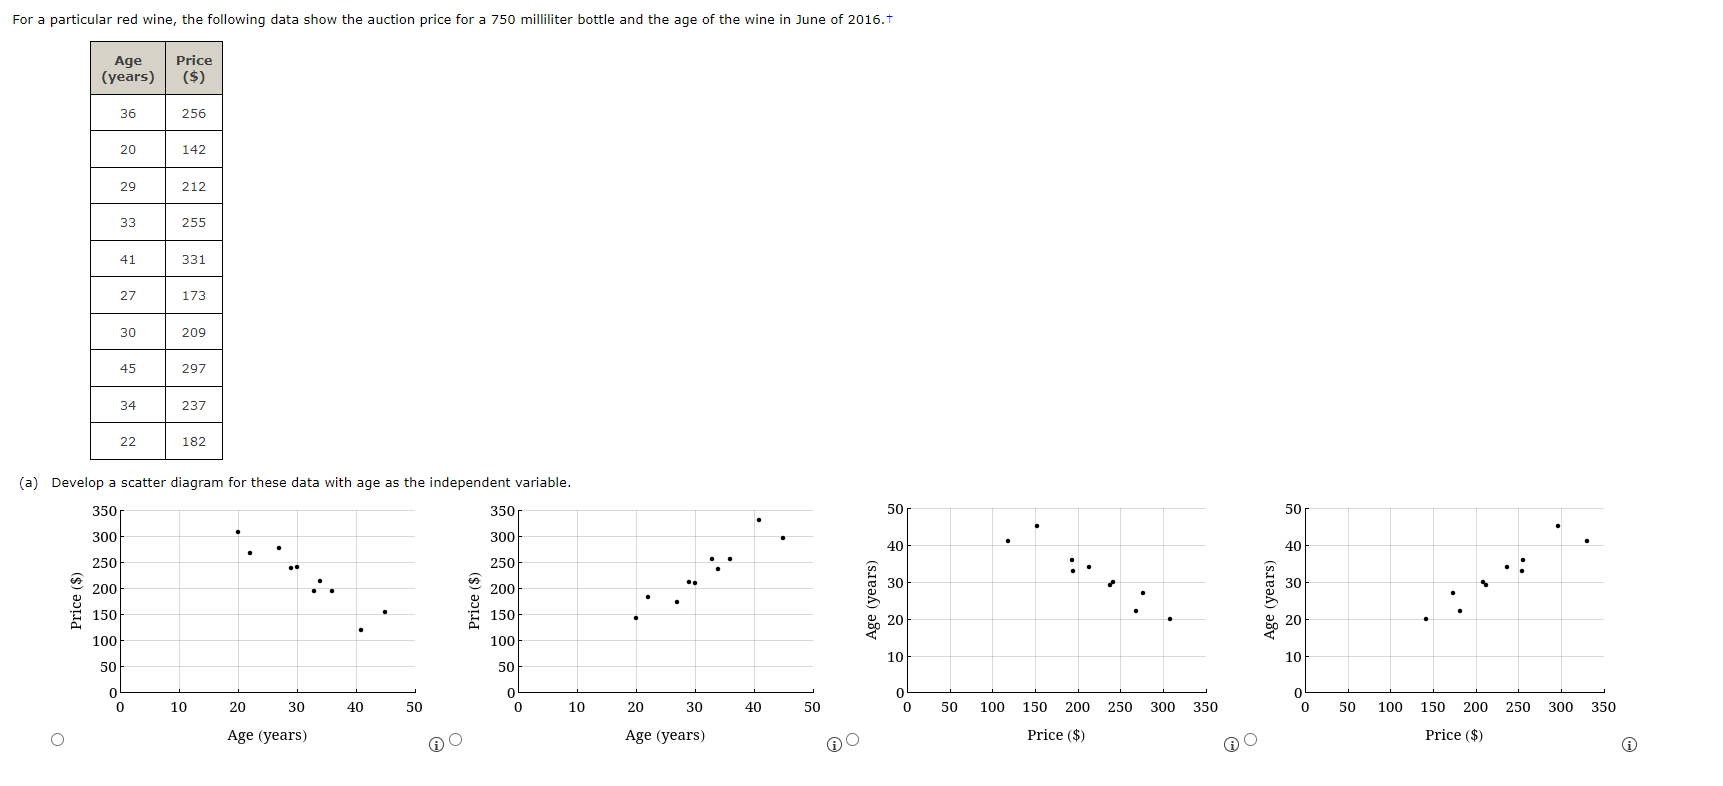


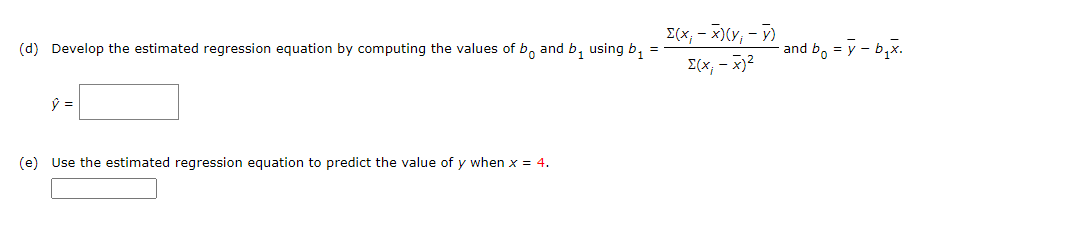

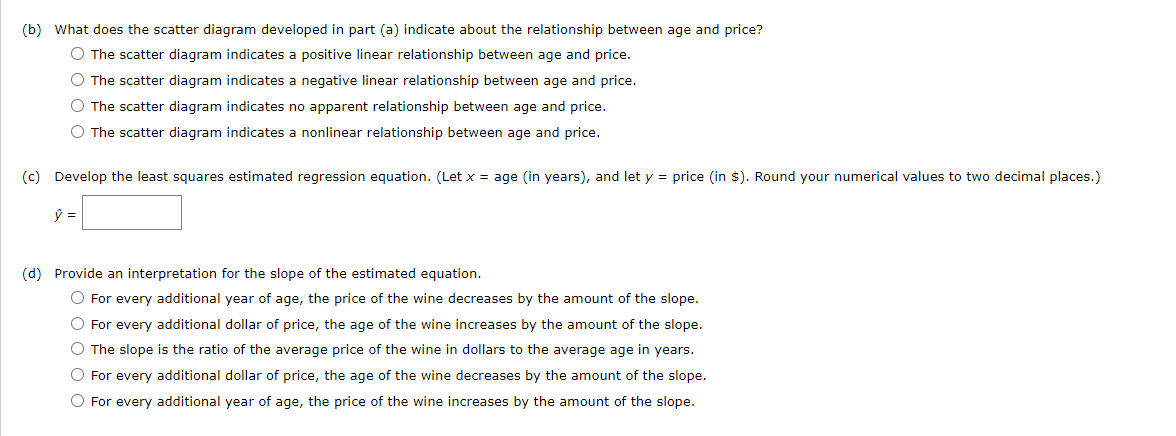
Given are five observations for two variables, x and y. X ; 1 2 3 4 5 10 (a) Develop a scatter diagram for these data. 18 18 18 T 18 15 15 15 15+ 12 12+ 12 12 9 9 9 9 . 6- 6- 6- 3 3 w X X X X 1 2 3 4 5 6 1 2 3 4 5 6 2 3 4 5 6 1 2 3 4 5 6 A (b) What does the scatter diagram developed in part (a) indicate about the relationship between the two variables? O There appears to be a negative linear relationship between x and y. O There appears to be a positive linear relationship between x and y. O There appears to be no noticeable relationship between x and y. (c) Try to approximate the relationship between x and y by drawing a straight line through the data. 18 - 18+ 18 18- 15 15 15 15- 12 12 12 12 9 9 9 - 6 6 6 3 3 3 3- X X X X 1 2 3 4 5 6 2 3 4 5 6 1 2 3 4 5 6 2 3 4 5 6(d) Develop the estimated regression equation by computing the values of bo and b, using b, = E ( x; - x ) (y; - V) and bo = y - b,x. E (x; - X) 2 (e) Use the estimated regression equation to predict the value of y when x = 4.For a particular red wine, the following data show the auction price for a 750 milliliter bottle and the age of the wine in June of 2016. t Age Price (years) ($) 36 256 20 142 29 212 33 255 41 331 27 173 30 209 45 297 34 237 22 182 (a) Develop a scatter diagram for these data with age as the independent variable. 350 350 50 50 300 300 40 40 250 250 200 200 30 30 Age (years) Price ($) Age (years) Price ( 150 150 20 20 100 10 10 10 50 50 0 O 0 10 20 30 40 50 0 10 20 30 40 50 0 50 100 150 200 250 300 350 100 150 200 250 300 350 O Age (years) Age (years) Price ($) Price ($)(b) What does the scatter diagram developed in part (a) indicate about the relationship between age and price? 0 The scatter diagram indicates a positive linear relationship between age and price. 0 The scatter diagram indicates a negative linear relationship between age and price. 0 The scatter diagram indicates no apparent relationship between age and price. 0 The scatter diagram indicates a nonlinear relationship between age and price. (c) Develop the least squares estimated regression equation. {Letx = age (in years), and let 1/ = price (in $). Round your numerical values to two decimal places.) f}: (d) Provide an interpretation for the slope of the estimated equation. 0 For every additional year of age, the price of the wine decreases by the amount of the slope. O For every additional dollar of price, the age of the wine increases by the amount of the slope. O The slope is the ratio of the average price of the wine in dollars to the average age in years. 0 For every additional dollar of price, the age of the wine decreases by the amount of the slope. O For every additional year of age, the price of the wine increases by the amount of the slope
Step by Step Solution
There are 3 Steps involved in it

Get step-by-step solutions from verified subject matter experts