

Question: Given below Hours Worked on System repairing System: 1. Use the DATA ANALYSIS add In to create a histogram for the above data of 6
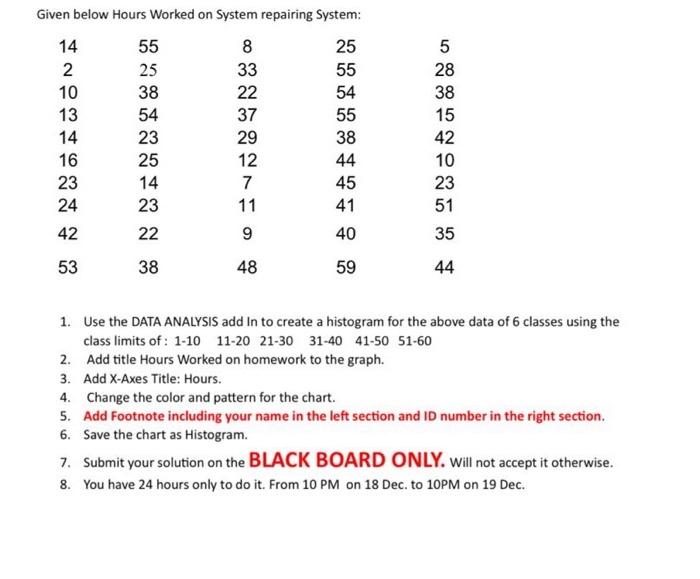
Given below Hours Worked on System repairing System: 14 55 8 25 5 2 25 33 55 28 10 38 22 54 38 13 54 37 55 15 14 23 29 38 42 16 25 12 44 10 23 14 7 45 23 24 23 11 41 51 42 53 38 20 22 9 40 35 48 59 44 1. Use the DATA ANALYSIS add In to create a histogram for the above data of 6 classes using the class limits of: 1-10 11-20 21-30 31-40 41-50 51-60 2. Add title Hours Worked on homework to the graph. 3. Add X-Axes Title: Hours. 4. Change the color and pattern for the chart. 5. Add Footnote including your name in the left section and ID number in the right section. 6. Save the chart as Histogram. 7. Submit your solution on the BLACK BOARD ONLY. Will not accept it otherwise. 8. You have 24 hours only to do it. From 10 PM on 18 Dec. to 10PM on 19 Dec.
Step by Step Solution
There are 3 Steps involved in it

Get step-by-step solutions from verified subject matter experts