

Question: Given data as attached picture, would you please tell me how to calculate / answer each of the following on excel spreadsheet? if you can
Given data as attached picture, would you please tell me how to calculateanswer each of the following on excel spreadsheet? if you can attached the picture of the spreadsheet with formula text that would be best.
a ?alpha of each stocks
b ?which stocks were underperformers, regardless of market movement ie ?stock would be down in a flat market
cWhich stocks ?had their proportion of systematic risk greater than
d ?Which stocks ?were less sensitive to the movements of the market then a typical stock?
e ?sharpe ratio of each stock
fWhich stocks ?had statistically significant overunderperformance outside of market movements during this period?
g ?Which stocks ?had their proportion of unsystematic risk to total risk greater than
hAssume the riskfree rate continues around ?basis points a month, the markets mean return will be ?basis points. You have analyzed these stocks and forecast that they will outperform by ?basis points per month in a flat market environment going forward. It is your practice to keep historical standard deviations and correlation coefficients constant in your forecasts. Which stock would have the highest expected Sharpe ratio of these five stocks?
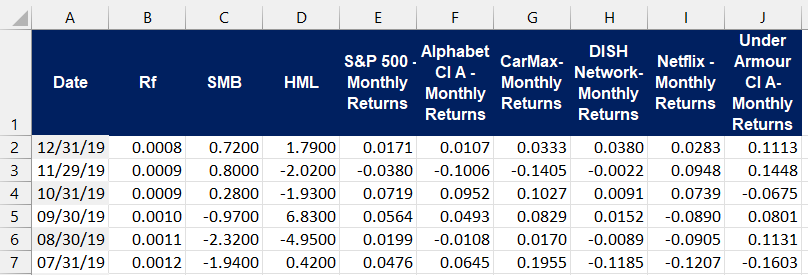
A B C D E F G H J Alphabet DISH S&P 500- CarMax- CIA- Network- Date Rf SMB HML Monthly Monthly Netflix Monthly Under Armour CI A- Monthly Monthly Returns Returns Returns Monthly Returns Returns 1 Returns 2 12/31/19 0.0008 0.7200 1.7900 3 4 11/29/19 10/31/19 6 0.0009 0.8000 -2.0200 0.0009 0.2800 -1.9300 5 09/30/19 0.0010 -0.9700 6.8300 08/30/19 0.0011 -2.3200 -4.9500 0.0199 7 07/31/19 0.0012 -1.9400 0.4200 0.0476 0.0171 0.0107 0.0333 0.0380 0.0283 0.1113 -0.0380 -0.1006 -0.1405 -0.0022 0.0948 0.1448 0.0719 0.0952 0.1027 0.0091 0.0739 -0.0675 0.0564 0.0493 0.0829 0.0152 -0.0890 0.0801 -0.0108 0.0170 -0.0089 -0.0905 0.1131 0.0645 0.1955 -0.1185 -0.1207 -0.1603
Step by Step Solution
There are 3 Steps involved in it

Get step-by-step solutions from verified subject matter experts