

Question: Given: Supposed your lowest score and highest score from all your quizzes and other class activities in the whole semester in Math 2 (Statistics)
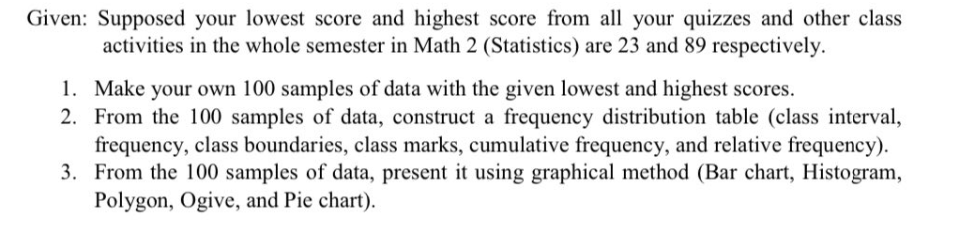
Given: Supposed your lowest score and highest score from all your quizzes and other class activities in the whole semester in Math 2 (Statistics) are 23 and 89 respectively. 1. Make your own 100 samples of data with the given lowest and highest scores. 2. From the 100 samples of data, construct a frequency distribution table (class interval, frequency, class boundaries, class marks, cumulative frequency, and relative frequency). 3. From the 100 samples of data, present it using graphical method (Bar chart, Histogram, Polygon, Ogive, and Pie chart).
Step by Step Solution
There are 3 Steps involved in it

Get step-by-step solutions from verified subject matter experts