

Question: Given the continuous function represented by the following (x, y) coordinates at given values of t: a] Sketch the curve by using the 1values from
![at given values of t: a] Sketch the curve by using the](https://s3.amazonaws.com/si.experts.images/answers/2024/06/666ec4030aab0_170666ec402e2b7a.jpg)
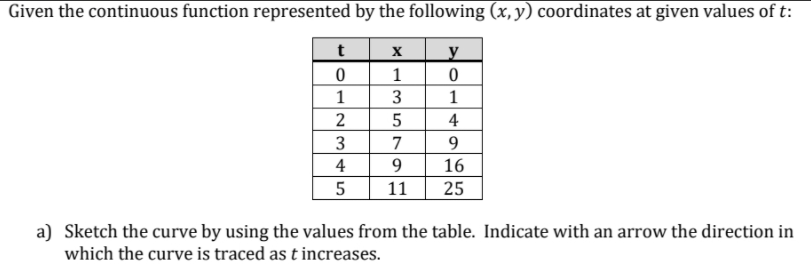
Given the continuous function represented by the following (x, y) coordinates at given values of t: a] Sketch the curve by using the 1values from the table. Indicate with an arrow the direction in which the curve is traced as it increases
Step by Step Solution
There are 3 Steps involved in it
1 Expert Approved Answer
Step: 1 Unlock

Question Has Been Solved by an Expert!
Get step-by-step solutions from verified subject matter experts
Step: 2 Unlock
Step: 3 Unlock