

Question: Given the data below and using Excel, construct the HISTOGRAM labeling the USL, LSL, and Xbar Specifications 6.00 + 0.05 Measurement Measurement Measurement 3 Subgroup
Given the data below and using Excel, construct the HISTOGRAM labeling the USL, LSL, and Xbar
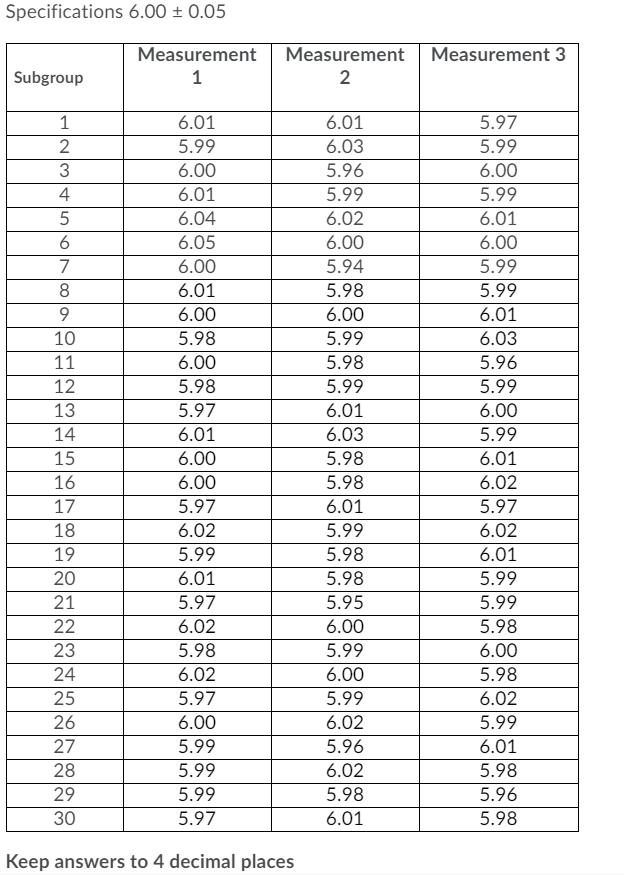
Specifications 6.00 + 0.05 Measurement Measurement Measurement 3 Subgroup 2 1 6.01 6.01 5.97 2 5.99 6.03 5.99 3 6.00 5.96 6.00 4 6.01 5.99 5.99 6.04 6.02 6.01 6.05 6.00 6.00 7 6.00 5.94 5.99 8 6.01 5.98 5.99 9 6.00 6.00 6.01 10 5.98 5.99 6.03 11 6.00 5.98 5.96 12 5.98 5.99 5.99 13 5.97 6.01 6.00 14 6.01 6.03 5.99 15 6.00 5.98 6.01 16 6.00 5.98 6.02 17 5.97 6.01 5.97 18 6.02 5.99 6.02 19 5.99 5.98 6.01 20 6.01 5.98 5.99 21 5.97 5.95 5.99 22 6.02 6.00 5.98 23 5.98 5.99 6.00 24 6.02 6.00 5.98 25 5.97 5.99 6.02 26 6.00 6.02 5.99 27 5.99 5.96 6.01 28 5.99 6.02 5.98 29 5.99 5.98 5.96 30 5.97 6.01 5.98 Keep answers to 4 decimal places
Step by Step Solution
3.44 Rating (157 Votes )
There are 3 Steps involved in it
UCL X 60... View full answer

Get step-by-step solutions from verified subject matter experts
Document Format (2 attachments)
636306be29ef7_237748.pdf
180 KBs PDF File
636306be29ef7_237748.docx
120 KBs Word File